
Each month TFOA publishes an Economic Update for single family offices, covering U.S. Gross Domestic Product (GDP), the Consumer Price Index (CPI), the Producer Price Index (PPI), and import and export price trends, alongside selected state-level data.
Monthly Economic Updates
September 2026
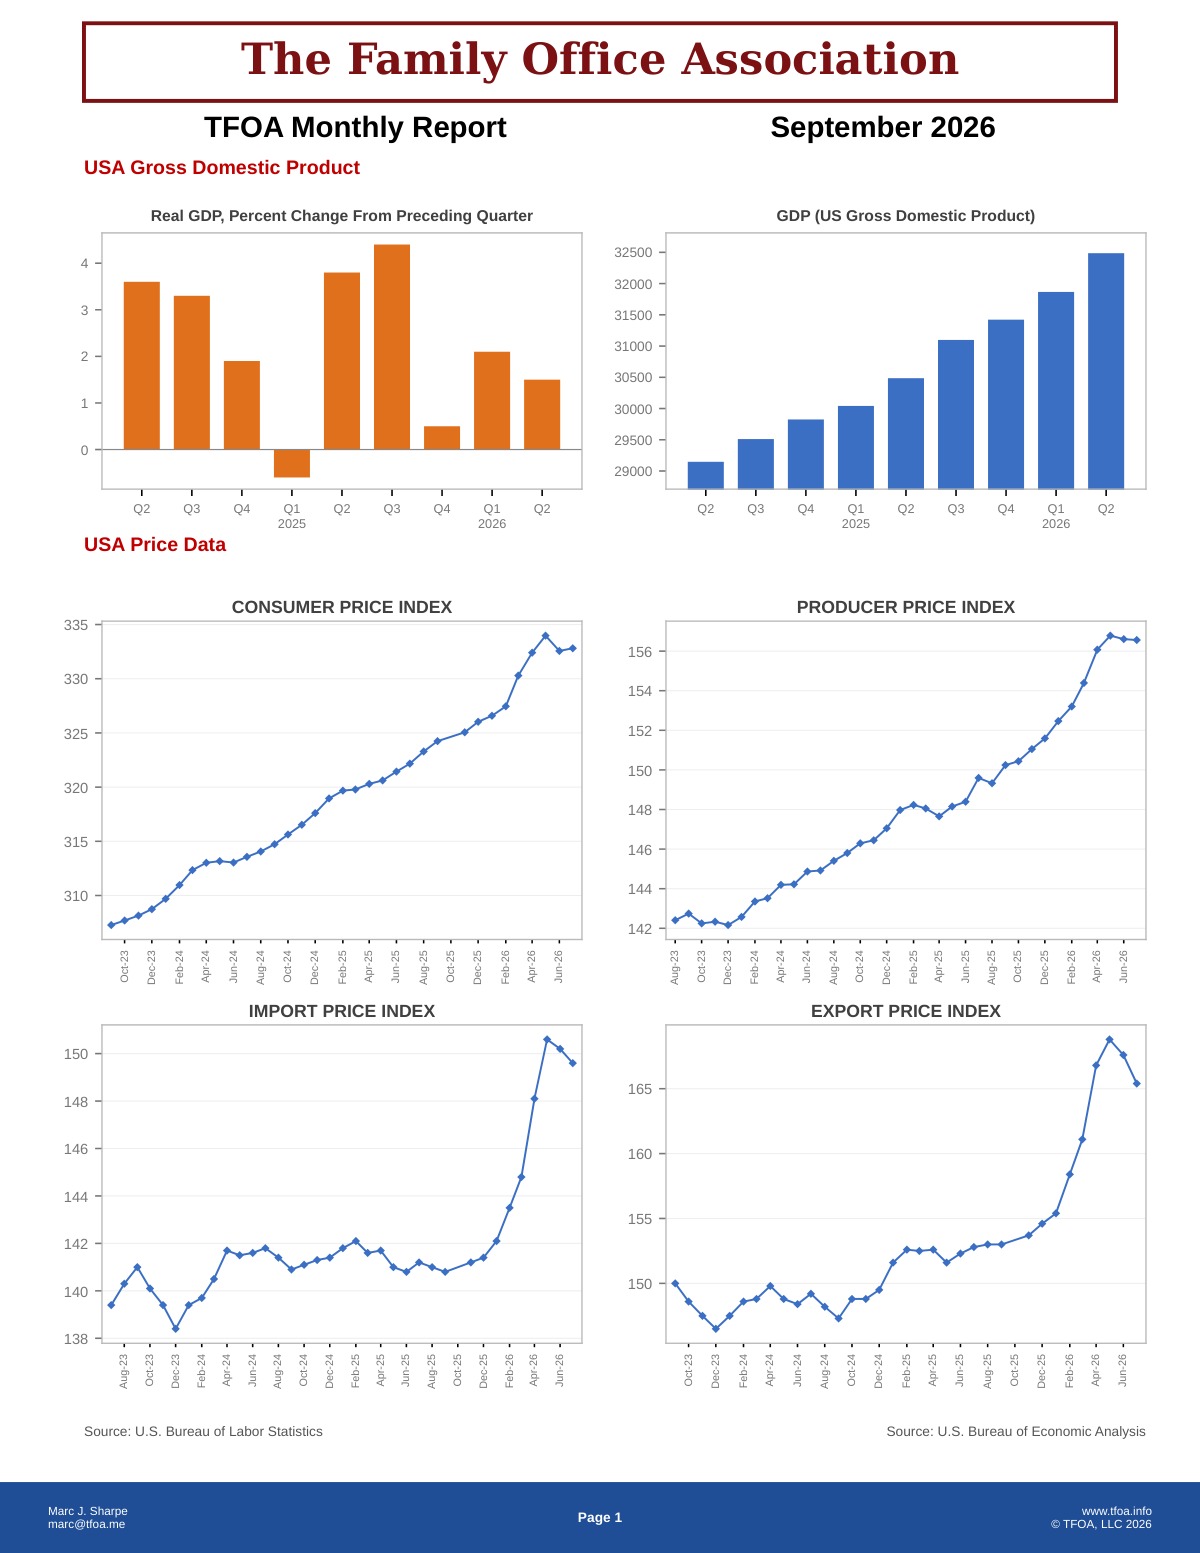
September 2026 — U.S. real GDP grew 1.5% in Q2 2026, with total output near $32.49 trillion. Consumer prices ran at 3.3% year over year (CPI 332.8), the Producer Price Index reached 156.6, and the import and export price indices stood at 149.6 and 165.4. The unemployment rate was 4.1%.
What did U.S. GDP do in the September 2026 TFOA Economic Update?
Real GDP grew 1.5% in Q2 2026, with total U.S. output near $32.49 trillion.
What was inflation in September 2026?
Consumer prices rose 3.3% year over year (CPI 332.8), and the Producer Price Index was 156.6.
What does the September 2026 TFOA Economic Update cover?
U.S. GDP, CPI, PPI, import and export price indices (149.6 and 165.4), the unemployment rate (4.1%), and selected state-level data for California, Florida, New York and Texas.
August 2026
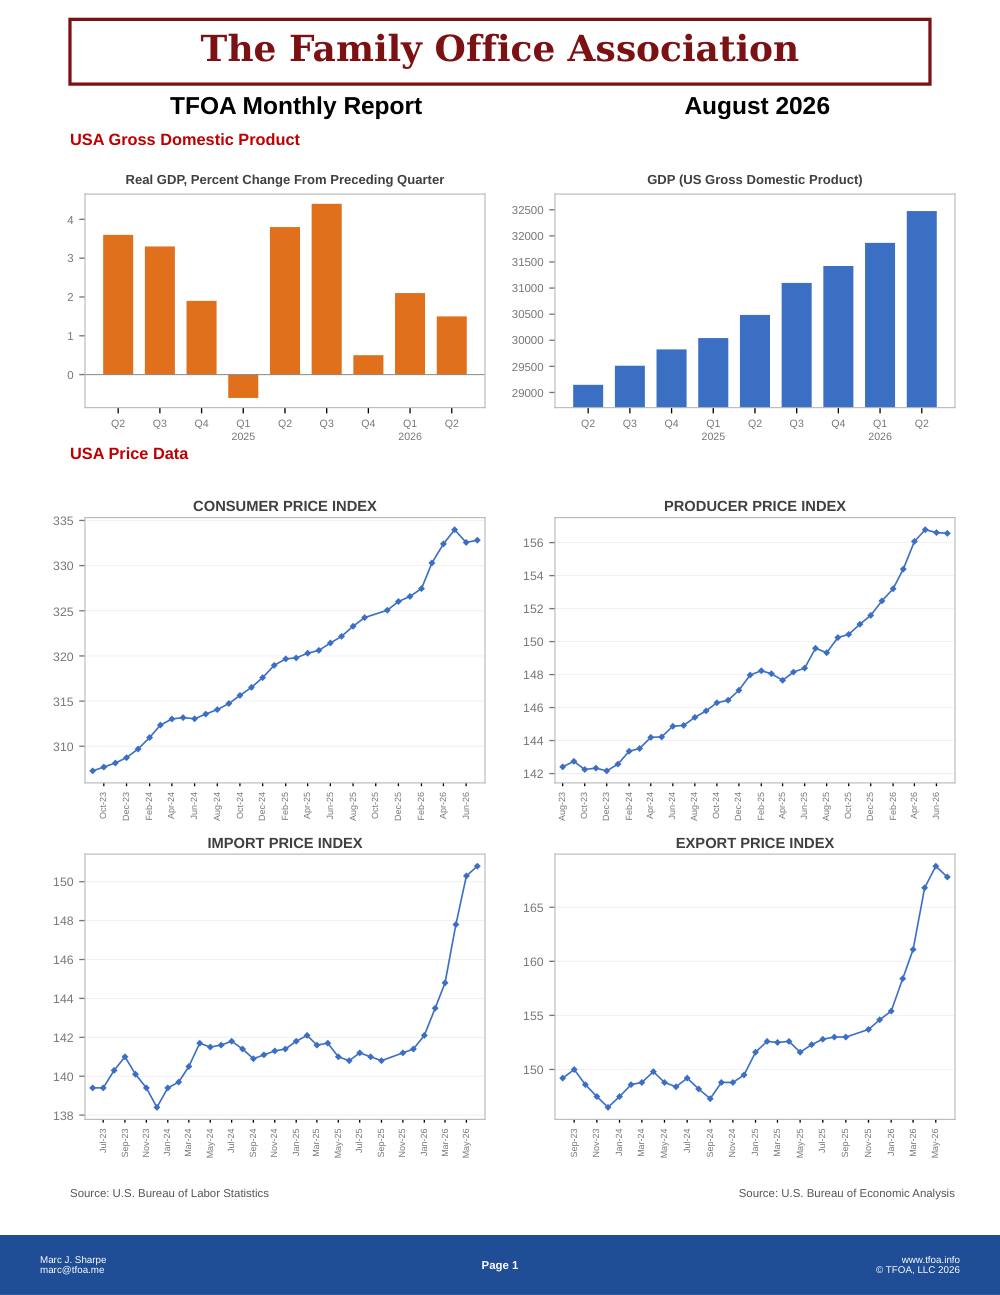
August 2026 — U.S. real GDP grew 1.5% in Q2 2026, with total output near $32.48 trillion. Consumer prices ran at 3.3% year over year (CPI 332.8), the Producer Price Index reached 156.6, and the import and export price indices stood at 150.8 and 167.8. The unemployment rate was 4.1%.
What did U.S. GDP do in the August 2026 TFOA Economic Update?
Real GDP grew 1.5% in Q2 2026, with total U.S. output near $32.48 trillion.
What was inflation in August 2026?
Consumer prices rose 3.3% year over year (CPI 332.8), and the Producer Price Index was 156.6.
What does the August 2026 TFOA Economic Update cover?
U.S. GDP, CPI, PPI, import and export price indices (150.8 and 167.8), the unemployment rate (4.1%), and selected state-level data for California, Florida, New York and Texas.
July 2026
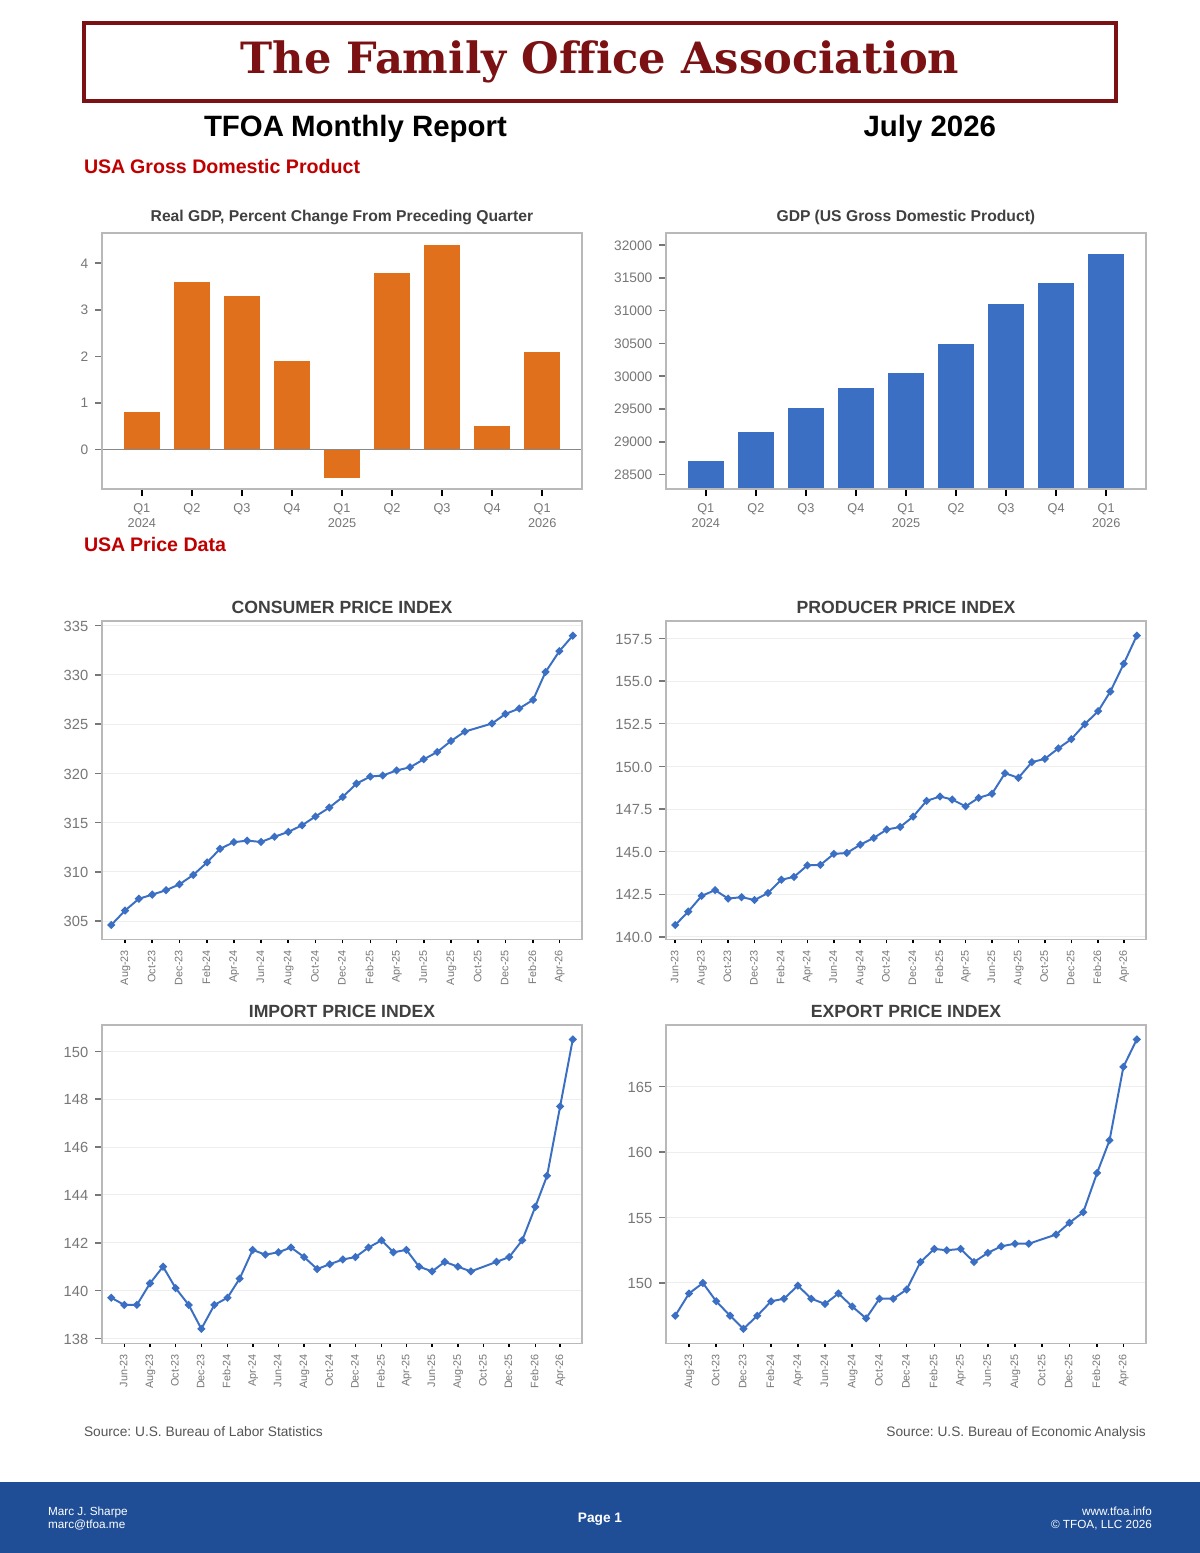
July 2026 — U.S. real GDP grew 2.1% in Q1 2026, with total output near $31.87 trillion. Consumer prices ran at 4.2% year over year (CPI 334.0), the Producer Price Index reached 157.7, and the import and export price indices stood at 150.5 and 168.6. The unemployment rate was 4.2%.
What did U.S. GDP do in the July 2026 TFOA Economic Update?
Real GDP grew 2.1% in Q1 2026, with total U.S. output near $31.87 trillion.
What was inflation in July 2026?
Consumer prices rose 4.2% year over year (CPI 334.0), and the Producer Price Index was 157.7.
What does the July 2026 TFOA Economic Update cover?
U.S. GDP, CPI, PPI, import and export price indices (150.5 and 168.6), the unemployment rate (4.2%), and selected state-level data for California, Florida, New York and Texas.
June 2026
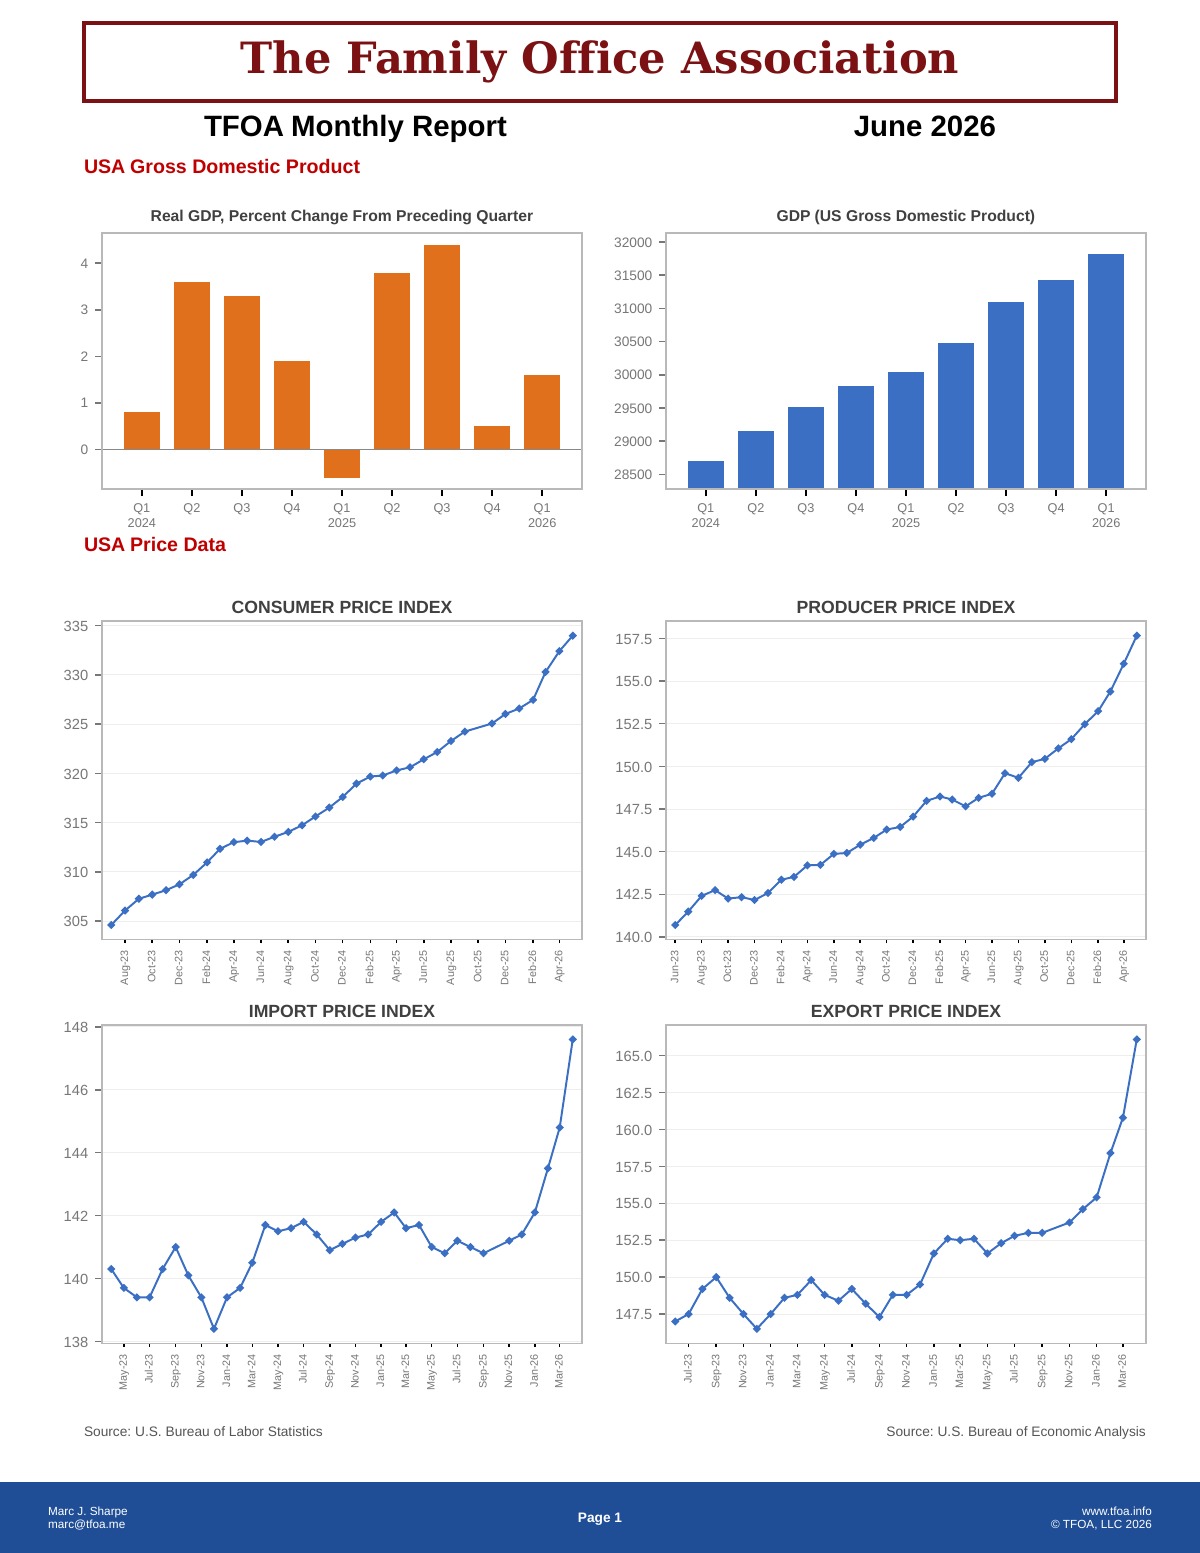
June 2026 — U.S. real GDP grew 2.1% in Q1 2026, with total output near $31.87 trillion. Consumer prices ran at 3.8% year over year (CPI 332.4), the Producer Price Index reached 156.0, and the import and export price indices stood at 147.7 and 166.5. The unemployment rate was 4.3%.
What did U.S. GDP do in the June 2026 TFOA Economic Update?
Real GDP grew 2.1% in Q1 2026, with total U.S. output near $31.87 trillion.
What was inflation in June 2026?
Consumer prices rose 3.8% year over year (CPI 332.4), and the Producer Price Index was 156.0.
What does the June 2026 TFOA Economic Update cover?
U.S. GDP, CPI, PPI, import and export price indices (147.7 and 166.5), the unemployment rate (4.3%), and selected state-level data for California, Florida, New York and Texas.
May 2026
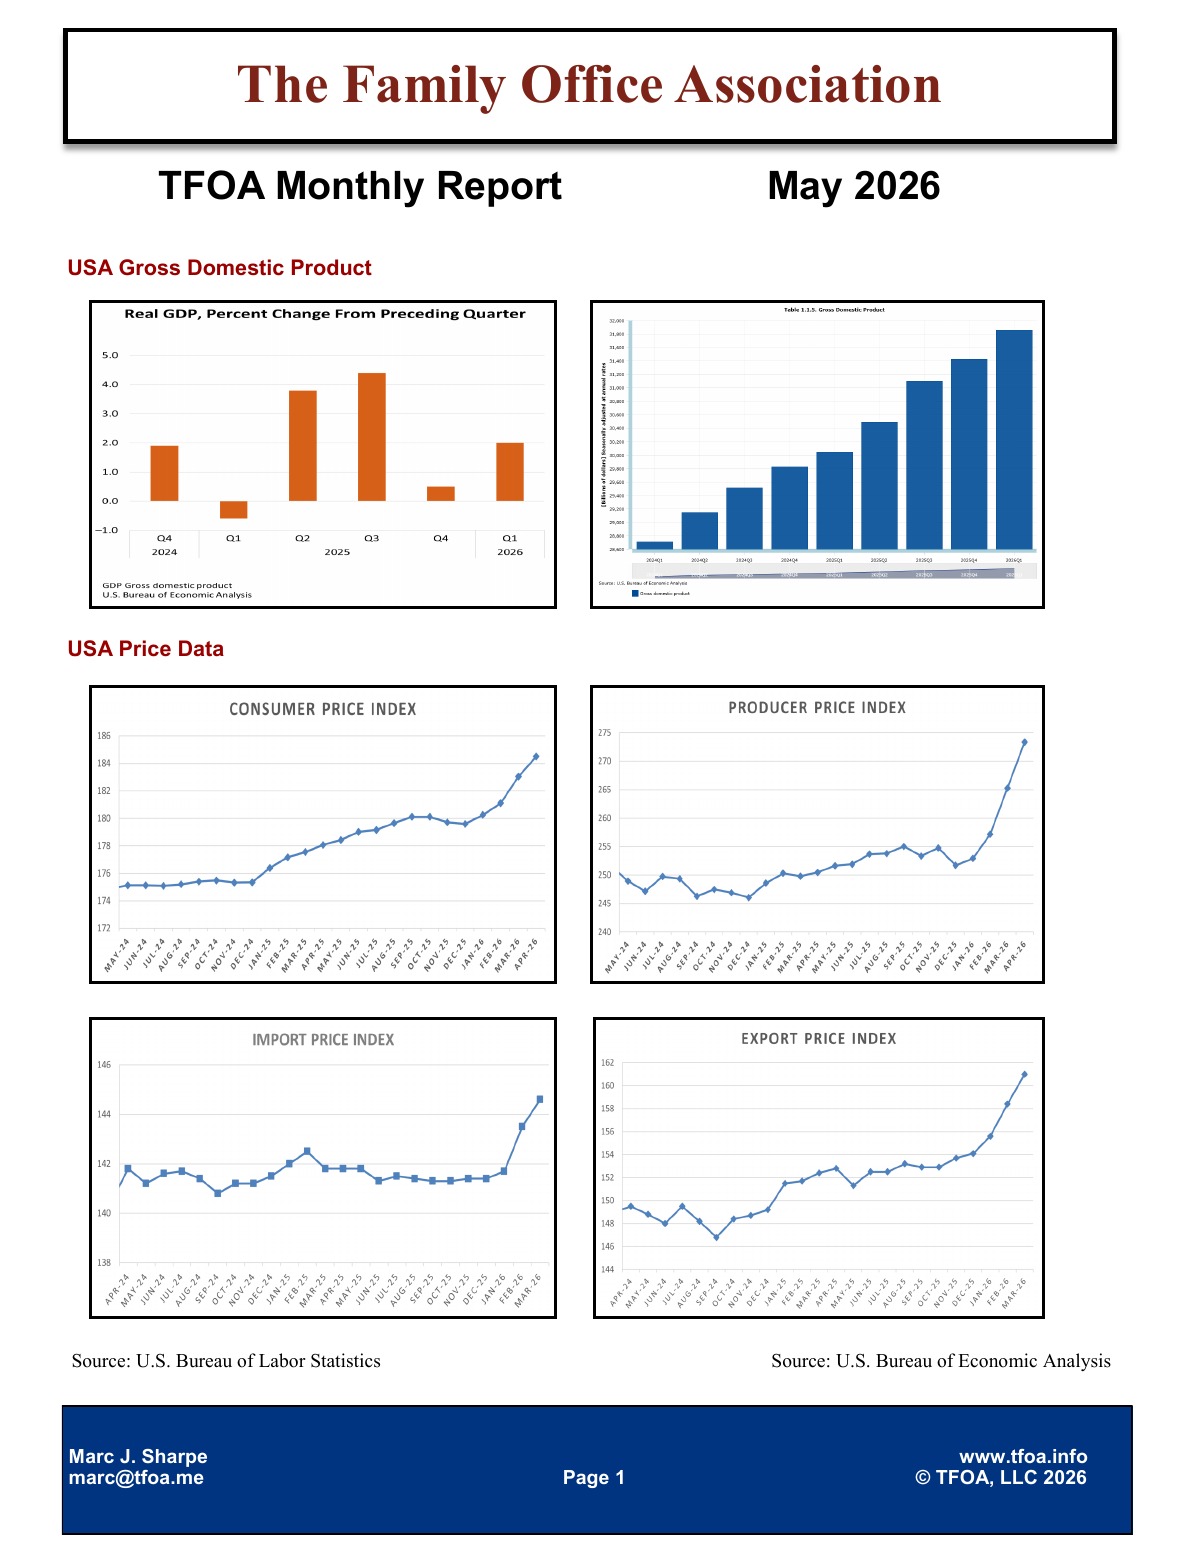
May 2026 — U.S. real GDP grew 2.1% in Q1 2026, with total output near $31.87 trillion. Consumer prices ran at 3.3% year over year (CPI 330.3), the Producer Price Index reached 154.4, and the import and export price indices stood at 144.8 and 160.9. The unemployment rate was 4.3%.
What did U.S. GDP do in the May 2026 TFOA Economic Update?
Real GDP grew 2.1% in Q1 2026, with total U.S. output near $31.87 trillion.
What was inflation in May 2026?
Consumer prices rose 3.3% year over year (CPI 330.3), and the Producer Price Index was 154.4.
What does the May 2026 TFOA Economic Update cover?
U.S. GDP, CPI, PPI, import and export price indices (144.8 and 160.9), the unemployment rate (4.3%), and selected state-level data for California, Florida, New York and Texas.
April 2026
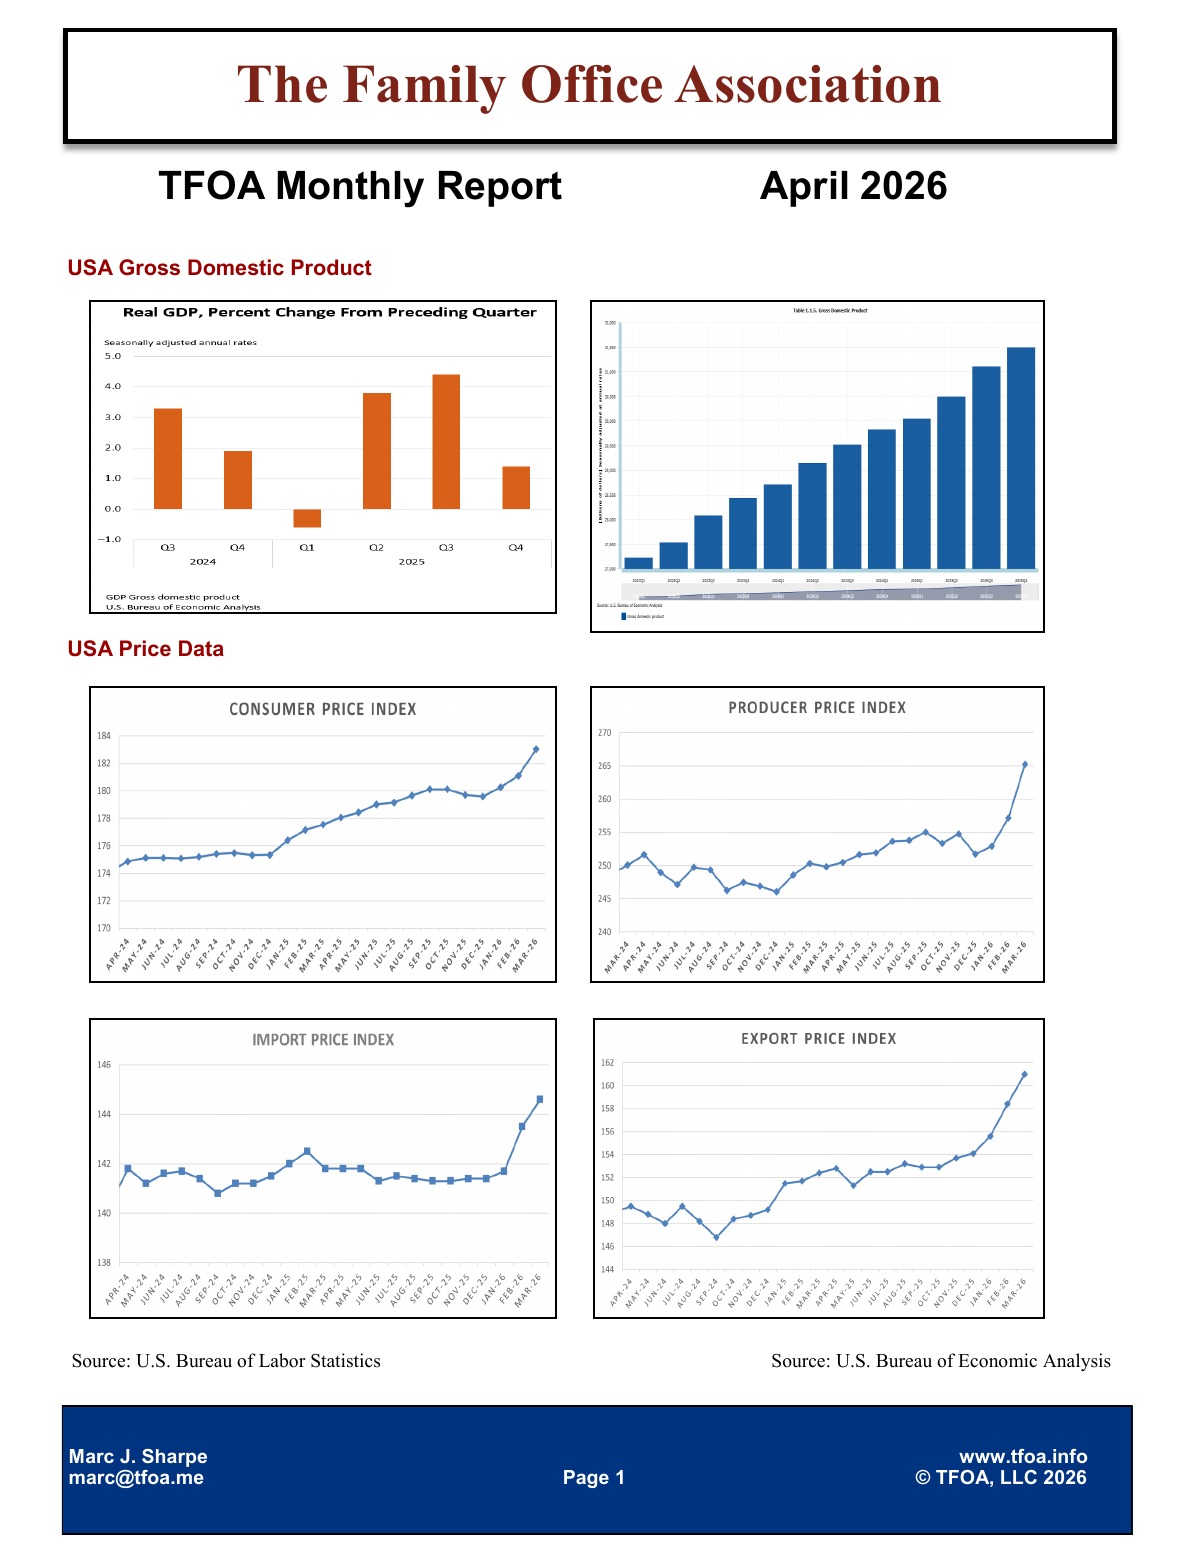
April 2026 — U.S. real GDP grew 2.1% in Q1 2026, with total output near $31.87 trillion. Consumer prices ran at 2.4% year over year (CPI 327.5), the Producer Price Index reached 153.2, and the import and export price indices stood at 143.5 and 158.4. The unemployment rate was 4.3%.
What did U.S. GDP do in the April 2026 TFOA Economic Update?
Real GDP grew 2.1% in Q1 2026, with total U.S. output near $31.87 trillion.
What was inflation in April 2026?
Consumer prices rose 2.4% year over year (CPI 327.5), and the Producer Price Index was 153.2.
What does the April 2026 TFOA Economic Update cover?
U.S. GDP, CPI, PPI, import and export price indices (143.5 and 158.4), the unemployment rate (4.3%), and selected state-level data for California, Florida, New York and Texas.
March 2026
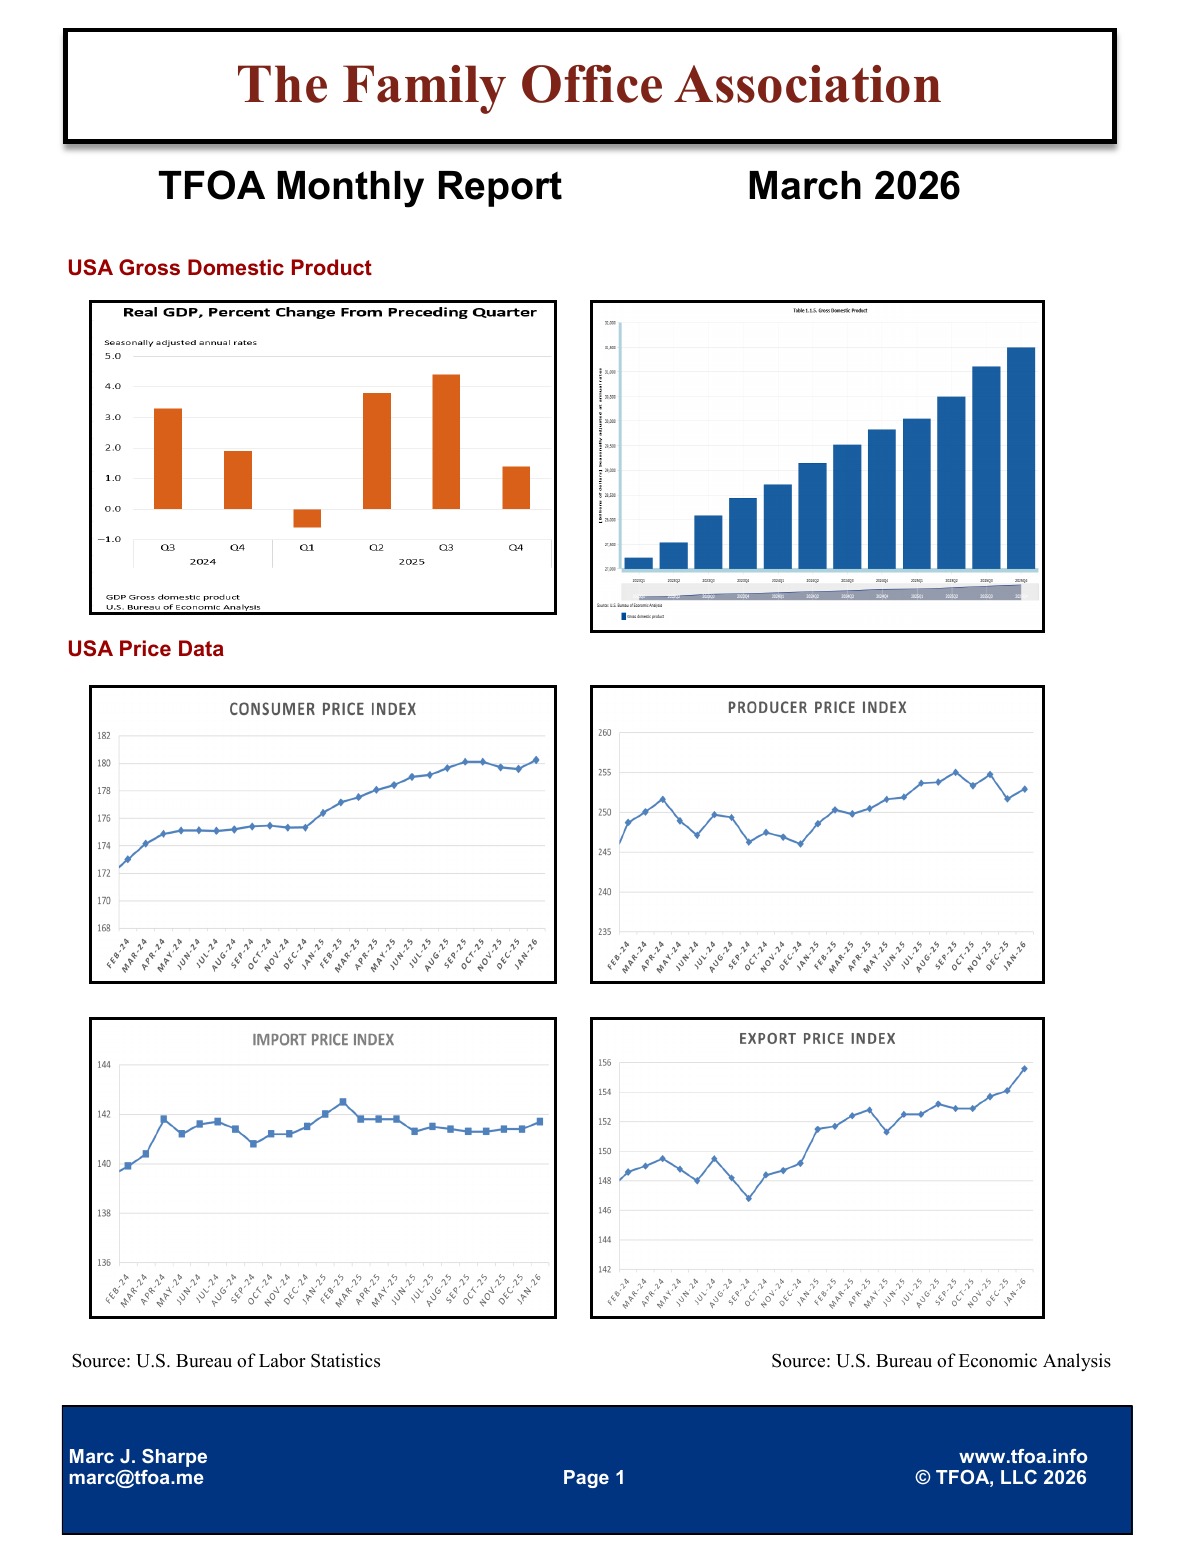
March 2026 — U.S. real GDP grew 2.1% in Q1 2026, with total output near $31.87 trillion. Consumer prices ran at 2.4% year over year (CPI 326.6), the Producer Price Index reached 152.5, and the import and export price indices stood at 142.1 and 155.4. The unemployment rate was 4.4%.
What did U.S. GDP do in the March 2026 TFOA Economic Update?
Real GDP grew 2.1% in Q1 2026, with total U.S. output near $31.87 trillion.
What was inflation in March 2026?
Consumer prices rose 2.4% year over year (CPI 326.6), and the Producer Price Index was 152.5.
What does the March 2026 TFOA Economic Update cover?
U.S. GDP, CPI, PPI, import and export price indices (142.1 and 155.4), the unemployment rate (4.4%), and selected state-level data for California, Florida, New York and Texas.
February 2026
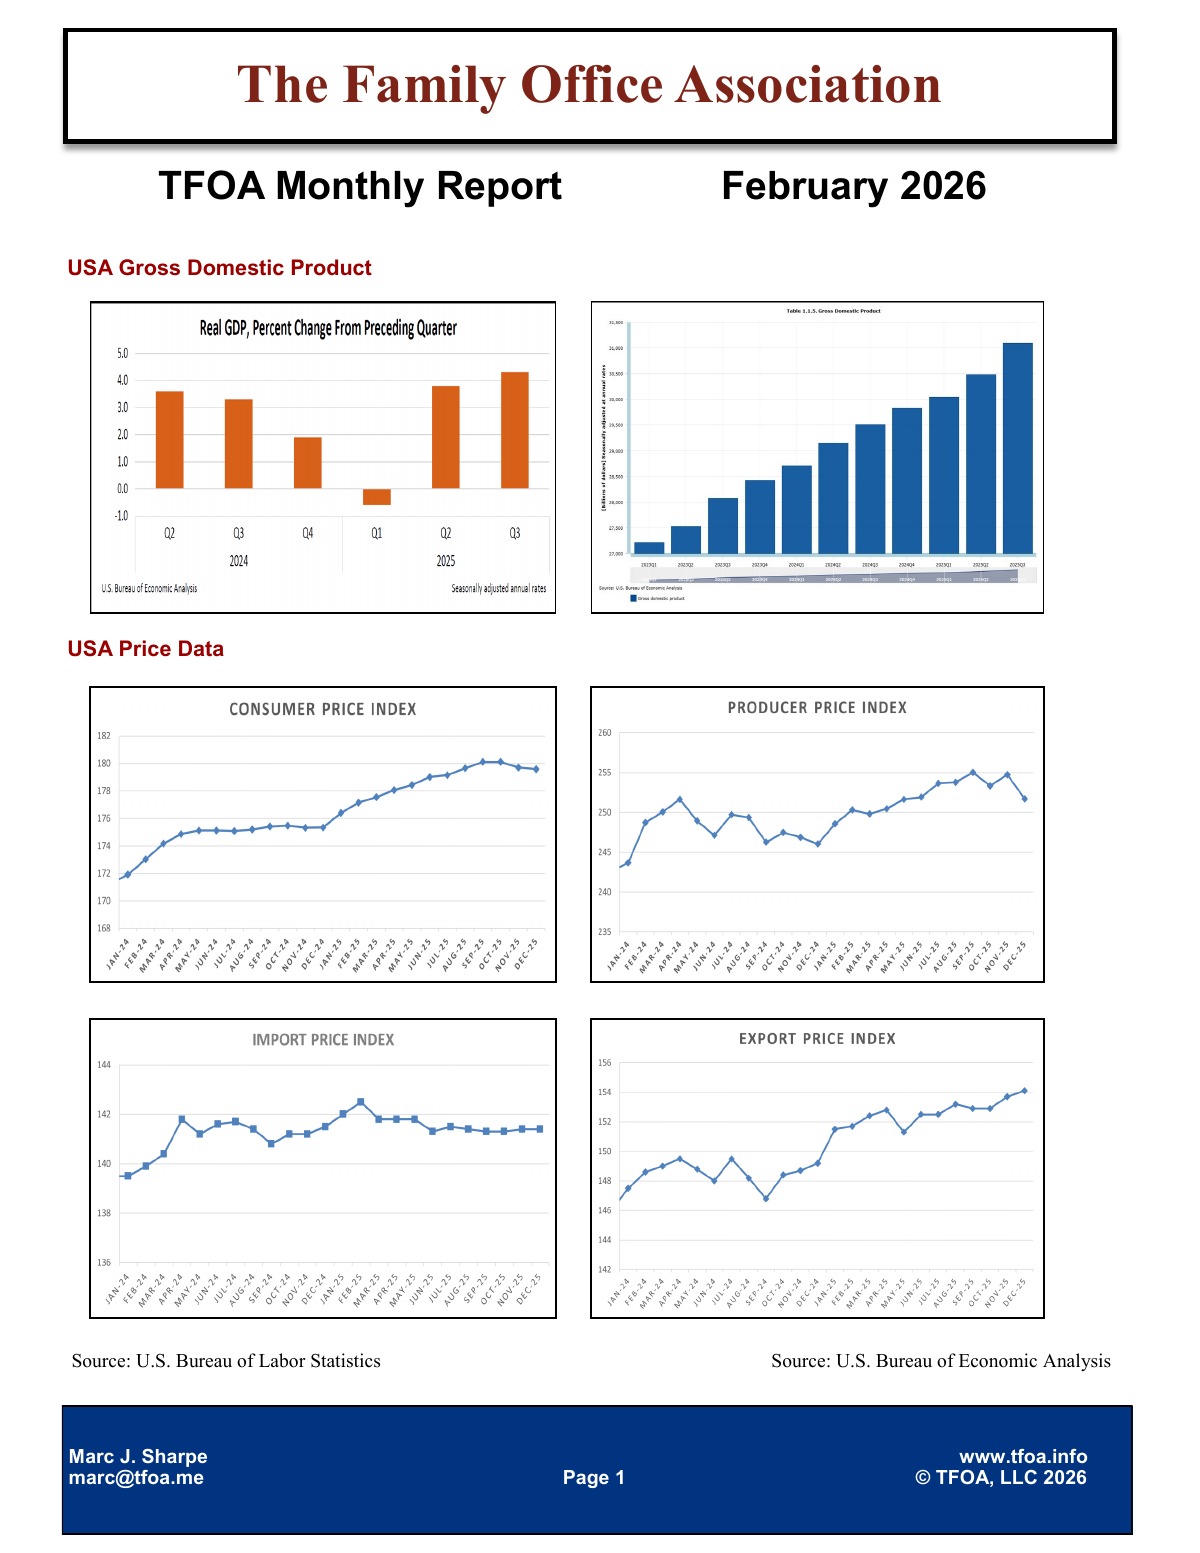
February 2026 — U.S. real GDP grew 2.1% in Q1 2026, with total output near $31.87 trillion. Consumer prices ran at 2.7% year over year (CPI 326.0), the Producer Price Index reached 151.6, and the import and export price indices stood at 141.4 and 154.6. The unemployment rate was 4.3%.
What did U.S. GDP do in the February 2026 TFOA Economic Update?
Real GDP grew 2.1% in Q1 2026, with total U.S. output near $31.87 trillion.
What was inflation in February 2026?
Consumer prices rose 2.7% year over year (CPI 326.0), and the Producer Price Index was 151.6.
What does the February 2026 TFOA Economic Update cover?
U.S. GDP, CPI, PPI, import and export price indices (141.4 and 154.6), the unemployment rate (4.3%), and selected state-level data for California, Florida, New York and Texas.
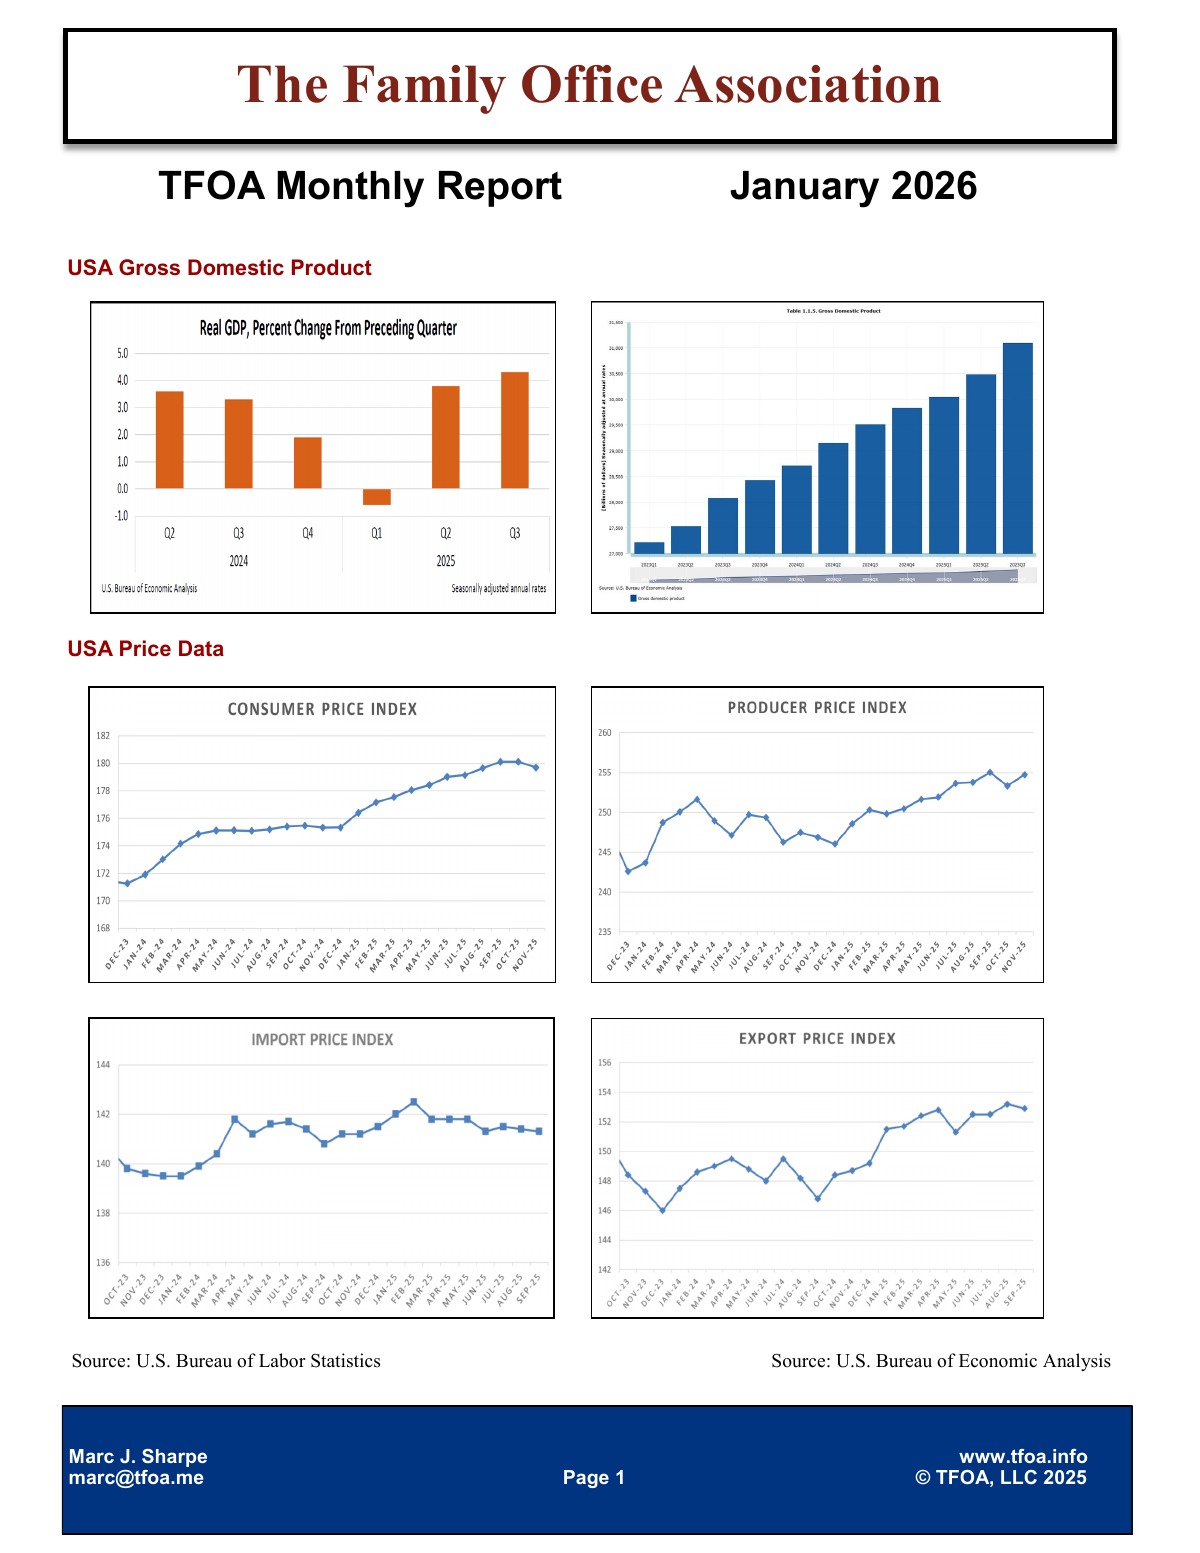
January 2026
January 2026 — U.S. real GDP grew 0.5% in Q4 2025, with total output near $31.42 trillion. Consumer prices ran at 2.7% year over year (CPI 325.1), the Producer Price Index reached 151.1, and the import and export price indices stood at 141.2 and 153.7. The unemployment rate was 4.4%.
What did U.S. GDP do in the January 2026 TFOA Economic Update?
Real GDP grew 0.5% in Q4 2025, with total U.S. output near $31.42 trillion.
What was inflation in January 2026?
Consumer prices rose 2.7% year over year (CPI 325.1), and the Producer Price Index was 151.1.
What does the January 2026 TFOA Economic Update cover?
U.S. GDP, CPI, PPI, import and export price indices (141.2 and 153.7), the unemployment rate (4.4%), and selected state-level data for California, Florida, New York and Texas.
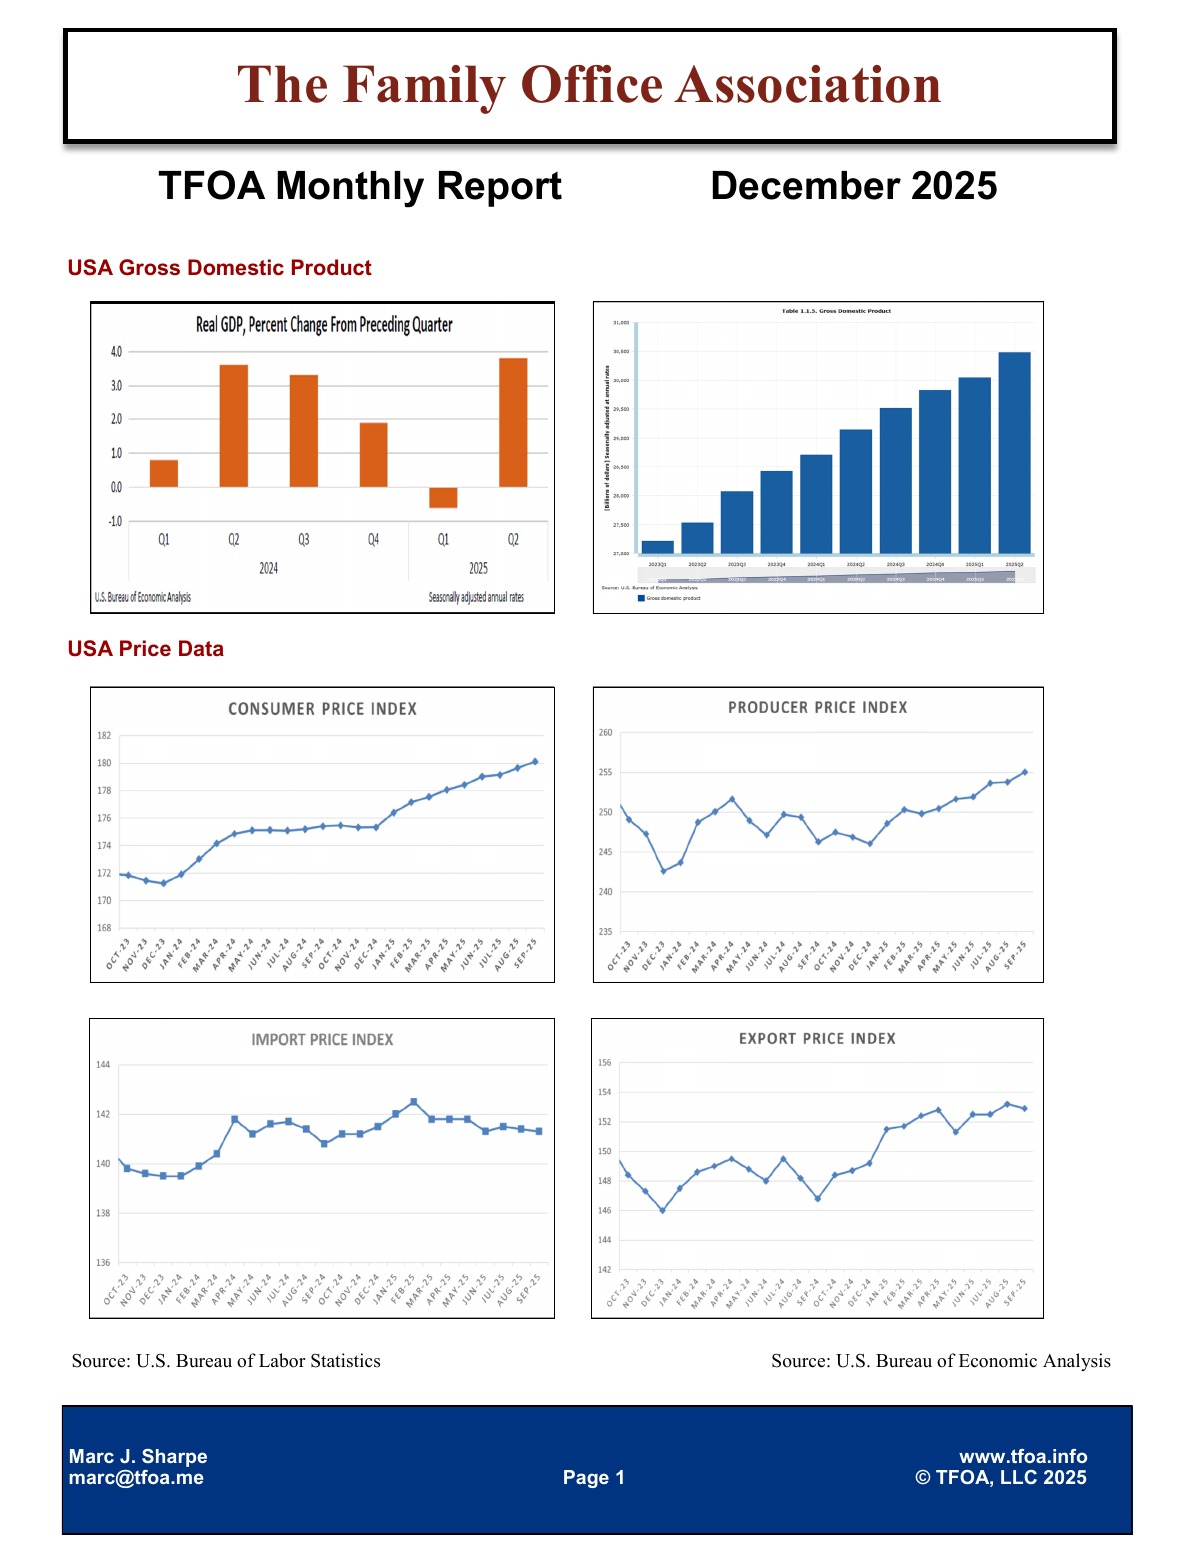
December 2025
December 2025 — U.S. real GDP grew 0.5% in Q4 2025, with total output near $31.42 trillion. Consumer prices ran at 3% year over year (CPI 324.2), the Producer Price Index reached 150.4, and the import and export price indices stood at 140.8 and 153. The unemployment rate was 4.5%.
What did U.S. GDP do in the December 2025 TFOA Economic Update?
Real GDP grew 0.5% in Q4 2025, with total U.S. output near $31.42 trillion.
What was inflation in December 2025?
Consumer prices rose 3% year over year (CPI 324.2), and the Producer Price Index was 150.4.
What does the December 2025 TFOA Economic Update cover?
U.S. GDP, CPI, PPI, import and export price indices (140.8 and 153), the unemployment rate (4.5%), and selected state-level data for California, Florida, New York and Texas.
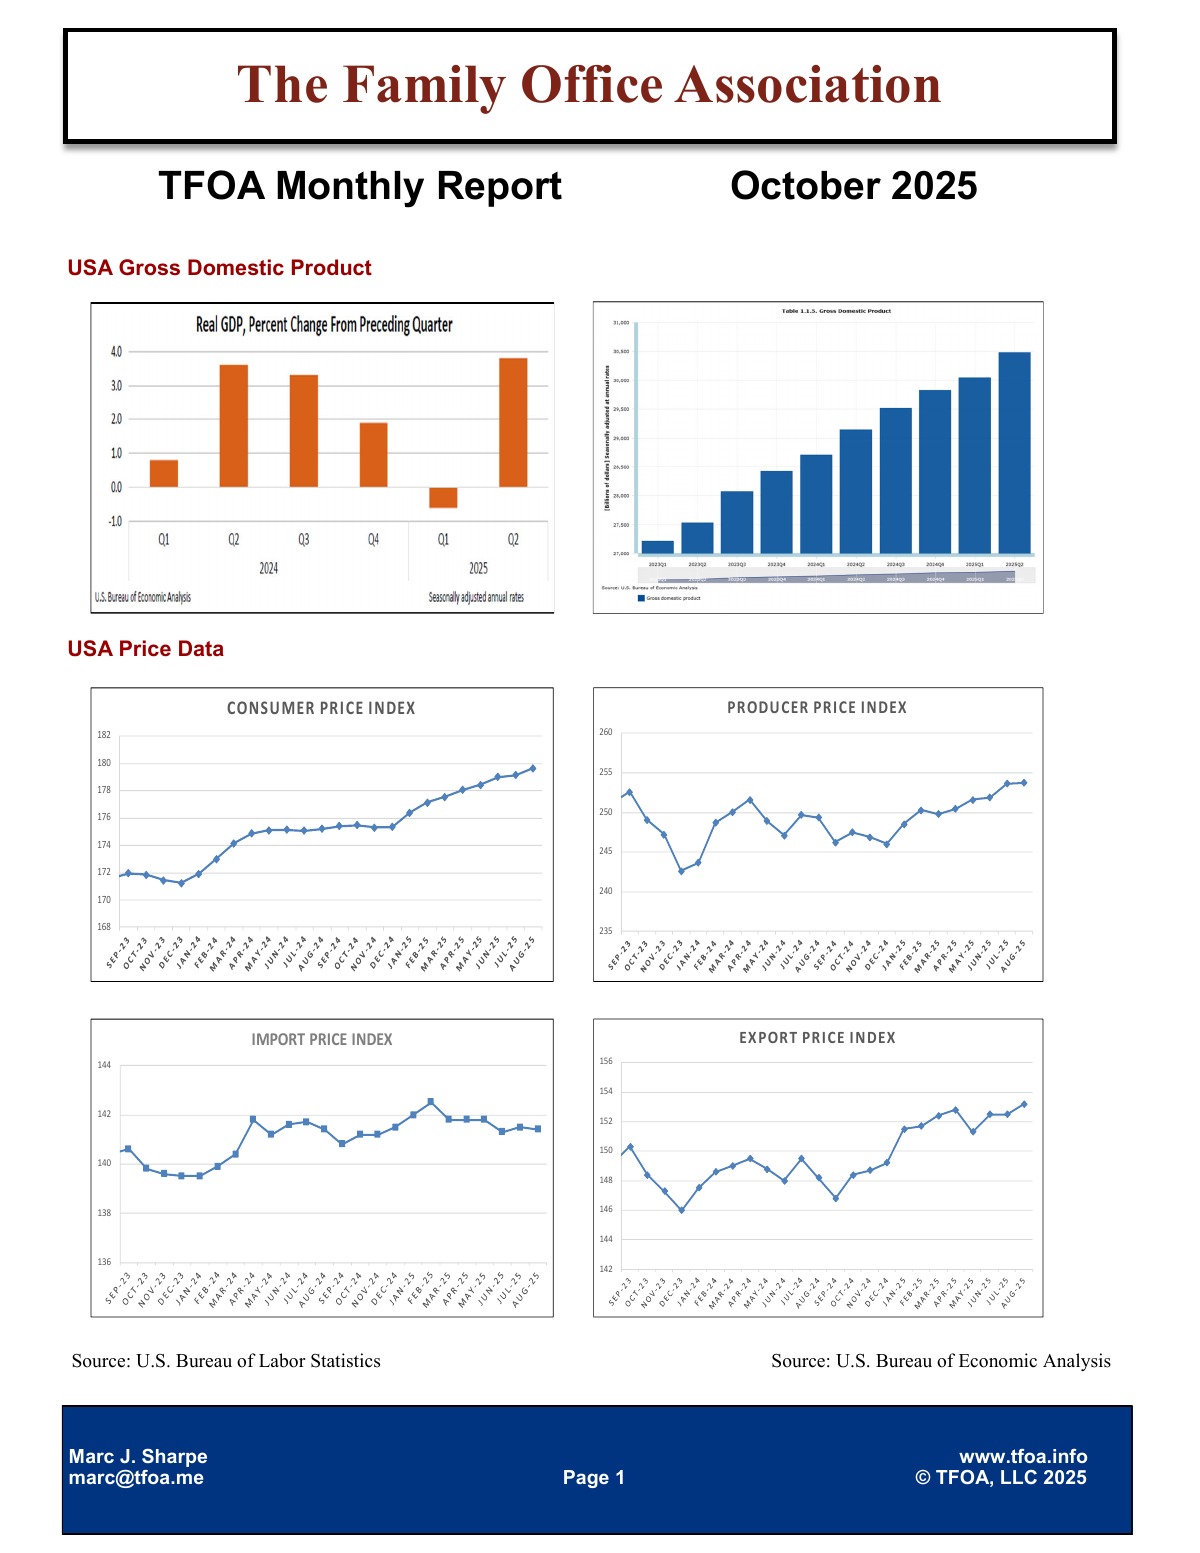
October 2025
October 2025 — U.S. real GDP grew 4.4% in Q3 2025, with total output near $31.10 trillion. Consumer prices ran at 2.9% year over year (CPI 323.3), the Producer Price Index reached 149.3, and the import and export price indices stood at 141 and 153. The unemployment rate was 4.4%.
What did U.S. GDP do in the October 2025 TFOA Economic Update?
Real GDP grew 4.4% in Q3 2025, with total U.S. output near $31.10 trillion.
What was inflation in October 2025?
Consumer prices rose 2.9% year over year (CPI 323.3), and the Producer Price Index was 149.3.
What does the October 2025 TFOA Economic Update cover?
U.S. GDP, CPI, PPI, import and export price indices (141 and 153), the unemployment rate (4.4%), and selected state-level data for California, Florida, New York and Texas.
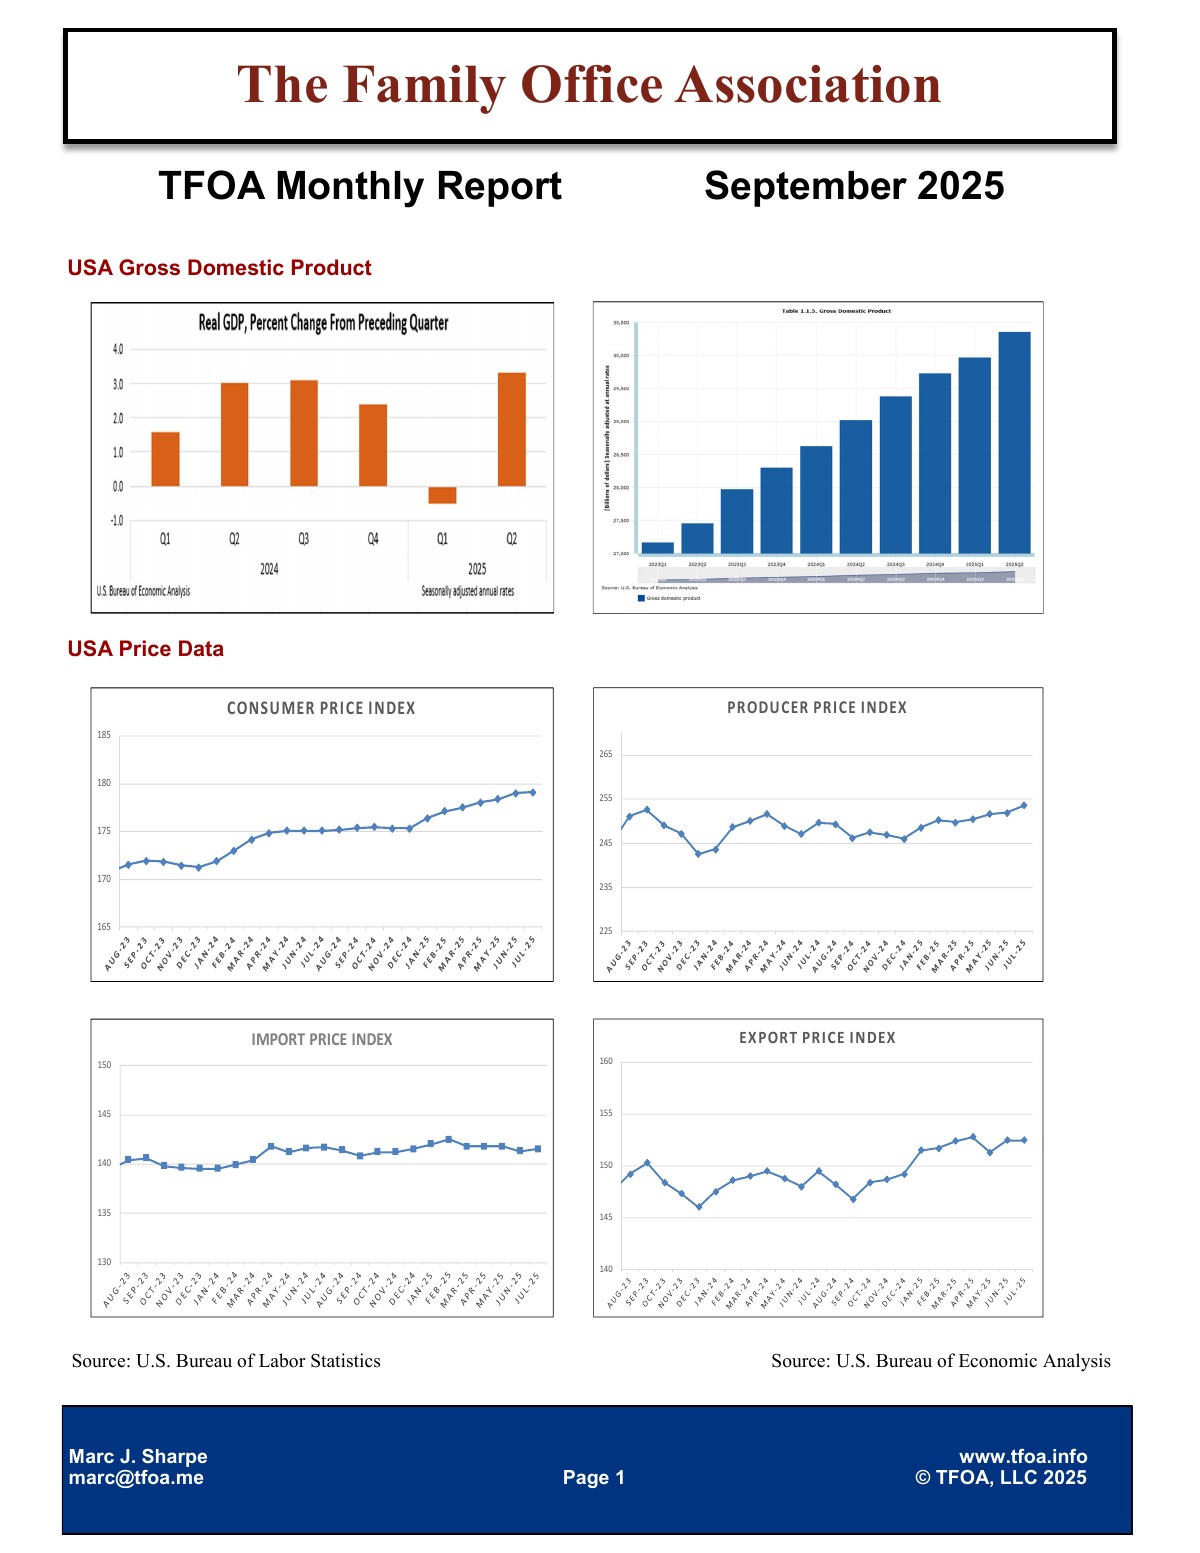
September 2025
September 2025 — U.S. real GDP grew 4.4% in Q3 2025, with total output near $31.10 trillion. Consumer prices ran at 2.7% year over year (CPI 322.2), the Producer Price Index reached 149.6, and the import and export price indices stood at 141.2 and 152.8. The unemployment rate was 4.3%.
What did U.S. GDP do in the September 2025 TFOA Economic Update?
Real GDP grew 4.4% in Q3 2025, with total U.S. output near $31.10 trillion.
What was inflation in September 2025?
Consumer prices rose 2.7% year over year (CPI 322.2), and the Producer Price Index was 149.6.
What does the September 2025 TFOA Economic Update cover?
U.S. GDP, CPI, PPI, import and export price indices (141.2 and 152.8), the unemployment rate (4.3%), and selected state-level data for California, Florida, New York and Texas.
August 2025
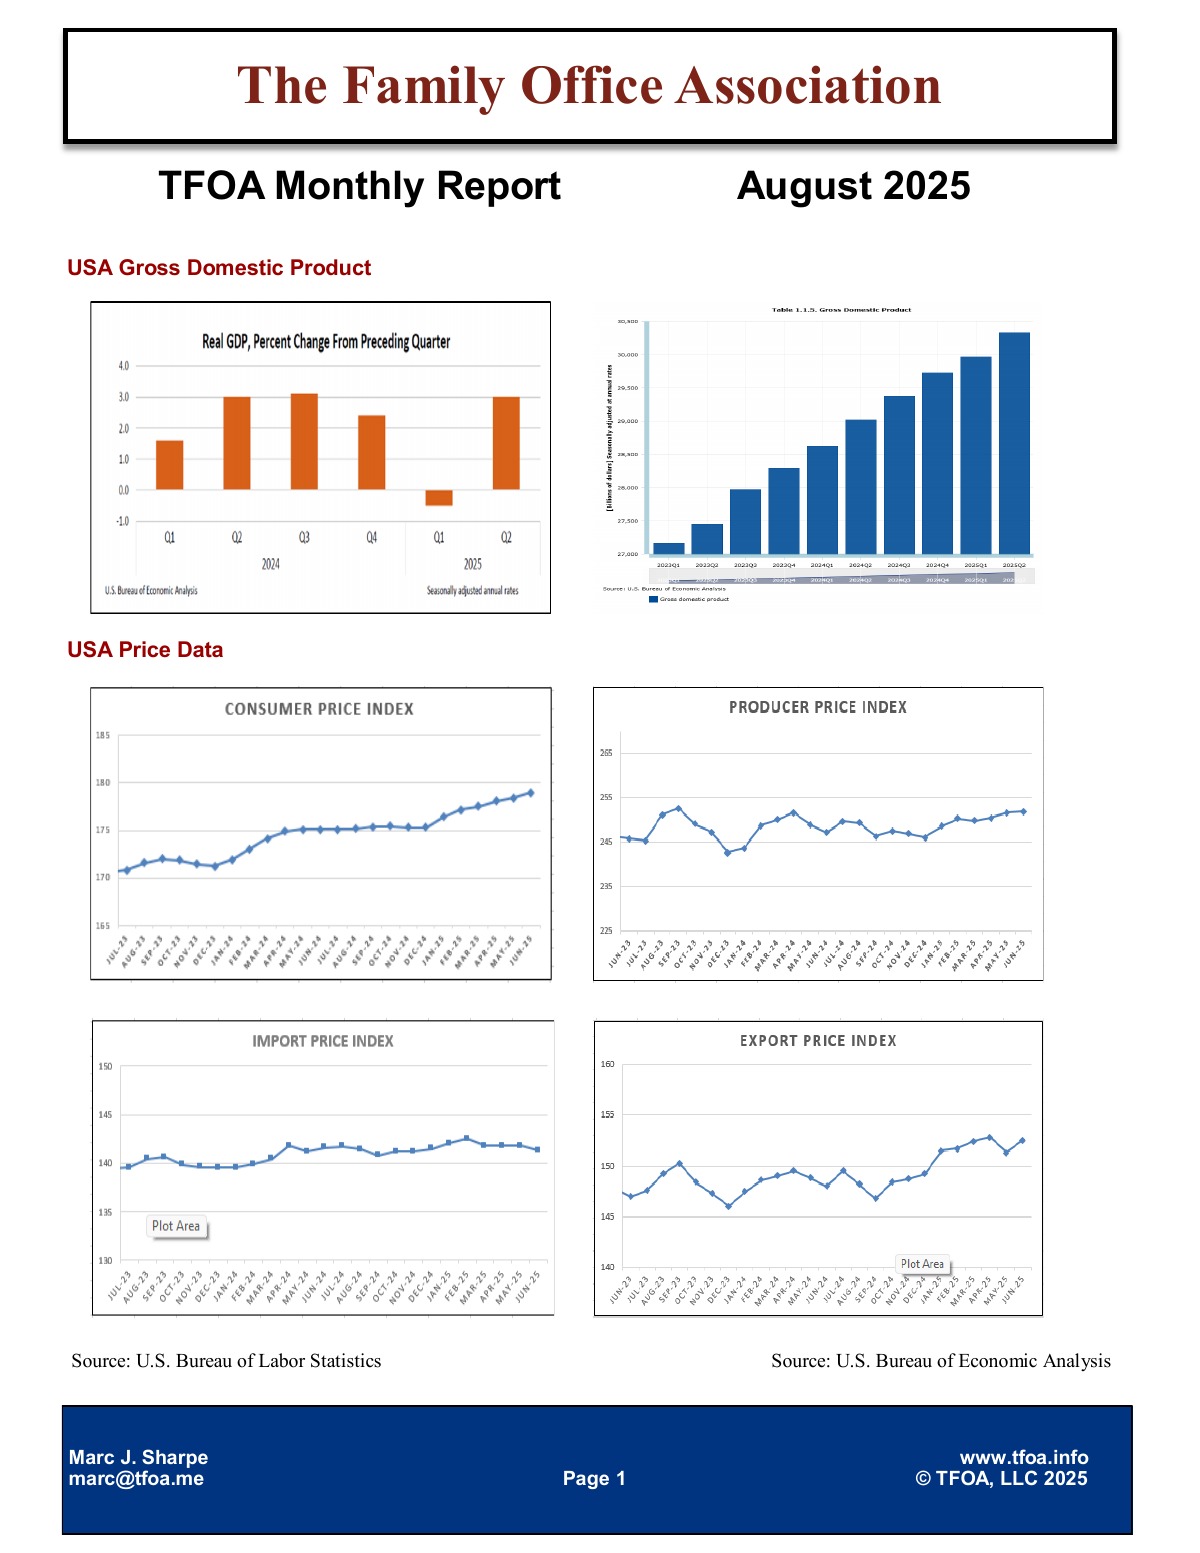
August 2025 — U.S. real GDP grew 4.4% in Q3 2025, with total output near $31.10 trillion. Consumer prices ran at 2.7% year over year (CPI 321.4), the Producer Price Index reached 148.4, and the import and export price indices stood at 140.8 and 152.3. The unemployment rate was 4.3%.
What did U.S. GDP do in the August 2025 TFOA Economic Update?
Real GDP grew 4.4% in Q3 2025, with total U.S. output near $31.10 trillion.
What was inflation in August 2025?
Consumer prices rose 2.7% year over year (CPI 321.4), and the Producer Price Index was 148.4.
What does the August 2025 TFOA Economic Update cover?
U.S. GDP, CPI, PPI, import and export price indices (140.8 and 152.3), the unemployment rate (4.3%), and selected state-level data for California, Florida, New York and Texas.
July 2025
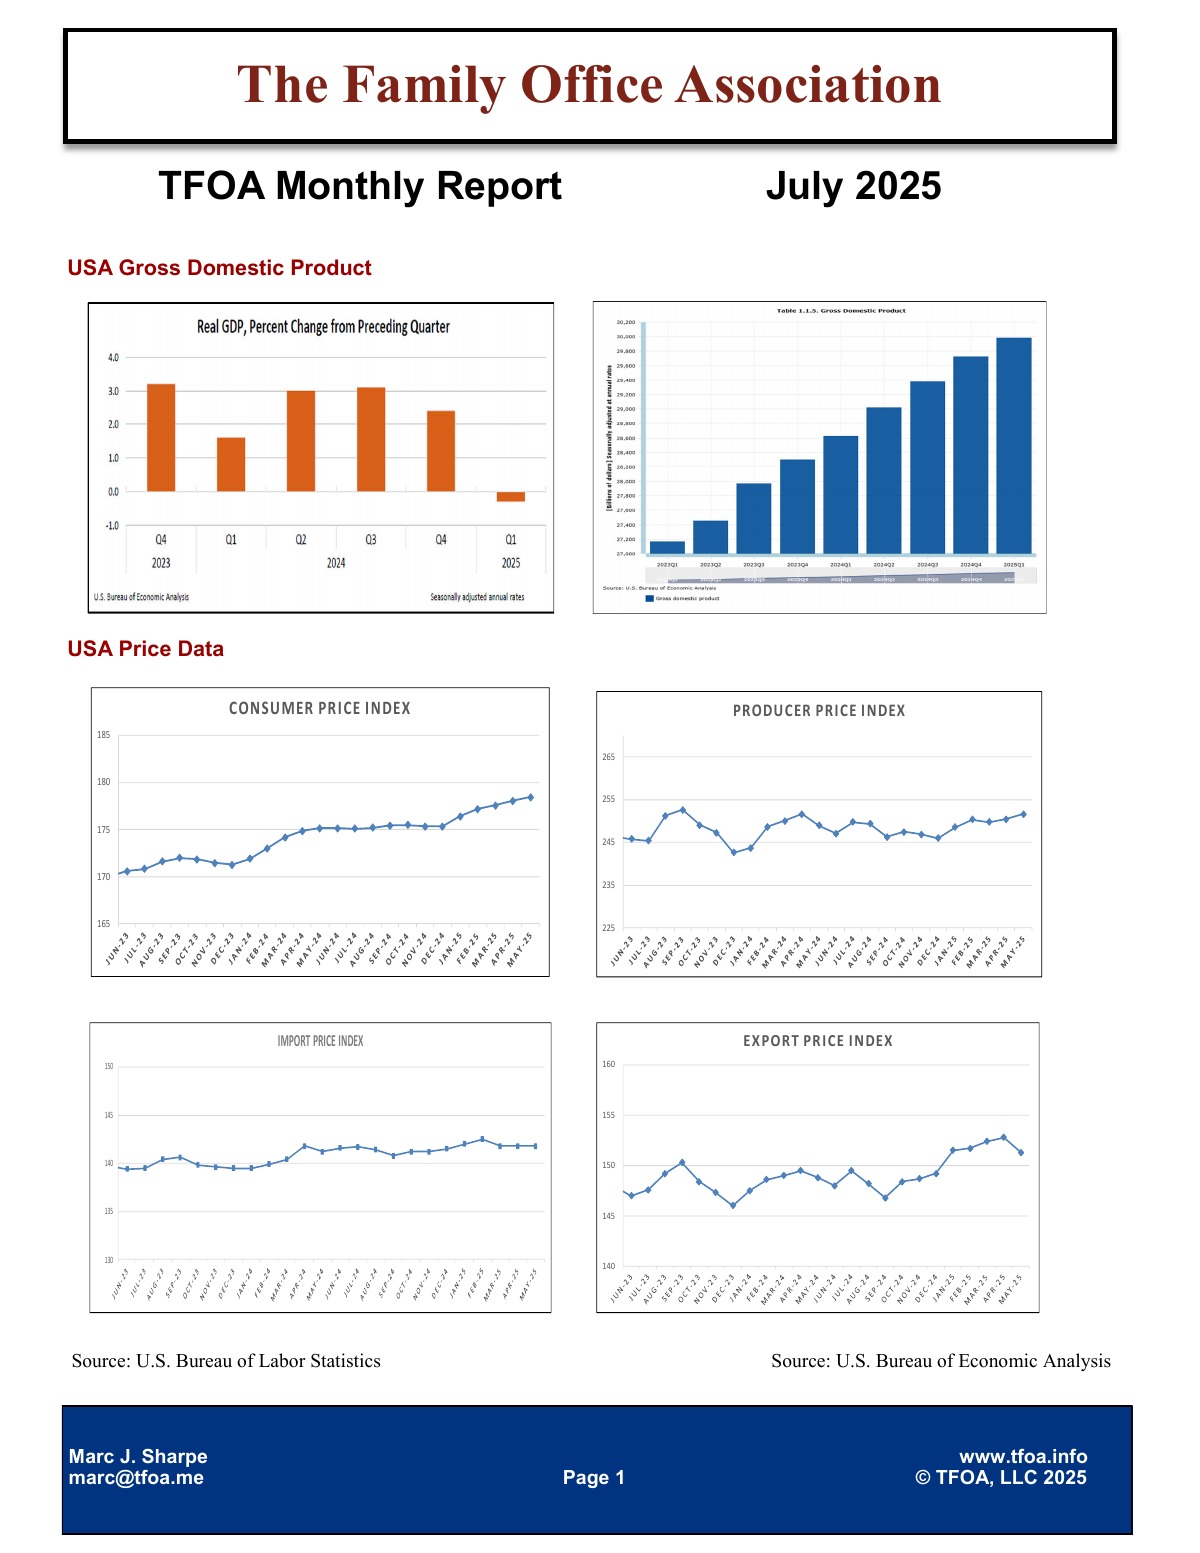
July 2025 — U.S. real GDP grew 3.8% in Q2 2025, with total output near $30.49 trillion. Consumer prices ran at 2.4% year over year (CPI 320.6), the Producer Price Index reached 148.2, and the import and export price indices stood at 141 and 151.6. The unemployment rate was 4.1%.
What did U.S. GDP do in the July 2025 TFOA Economic Update?
Real GDP grew 3.8% in Q2 2025, with total U.S. output near $30.49 trillion.
What was inflation in July 2025?
Consumer prices rose 2.4% year over year (CPI 320.6), and the Producer Price Index was 148.2.
What does the July 2025 TFOA Economic Update cover?
U.S. GDP, CPI, PPI, import and export price indices (141 and 151.6), the unemployment rate (4.1%), and selected state-level data for California, Florida, New York and Texas.
June 2025
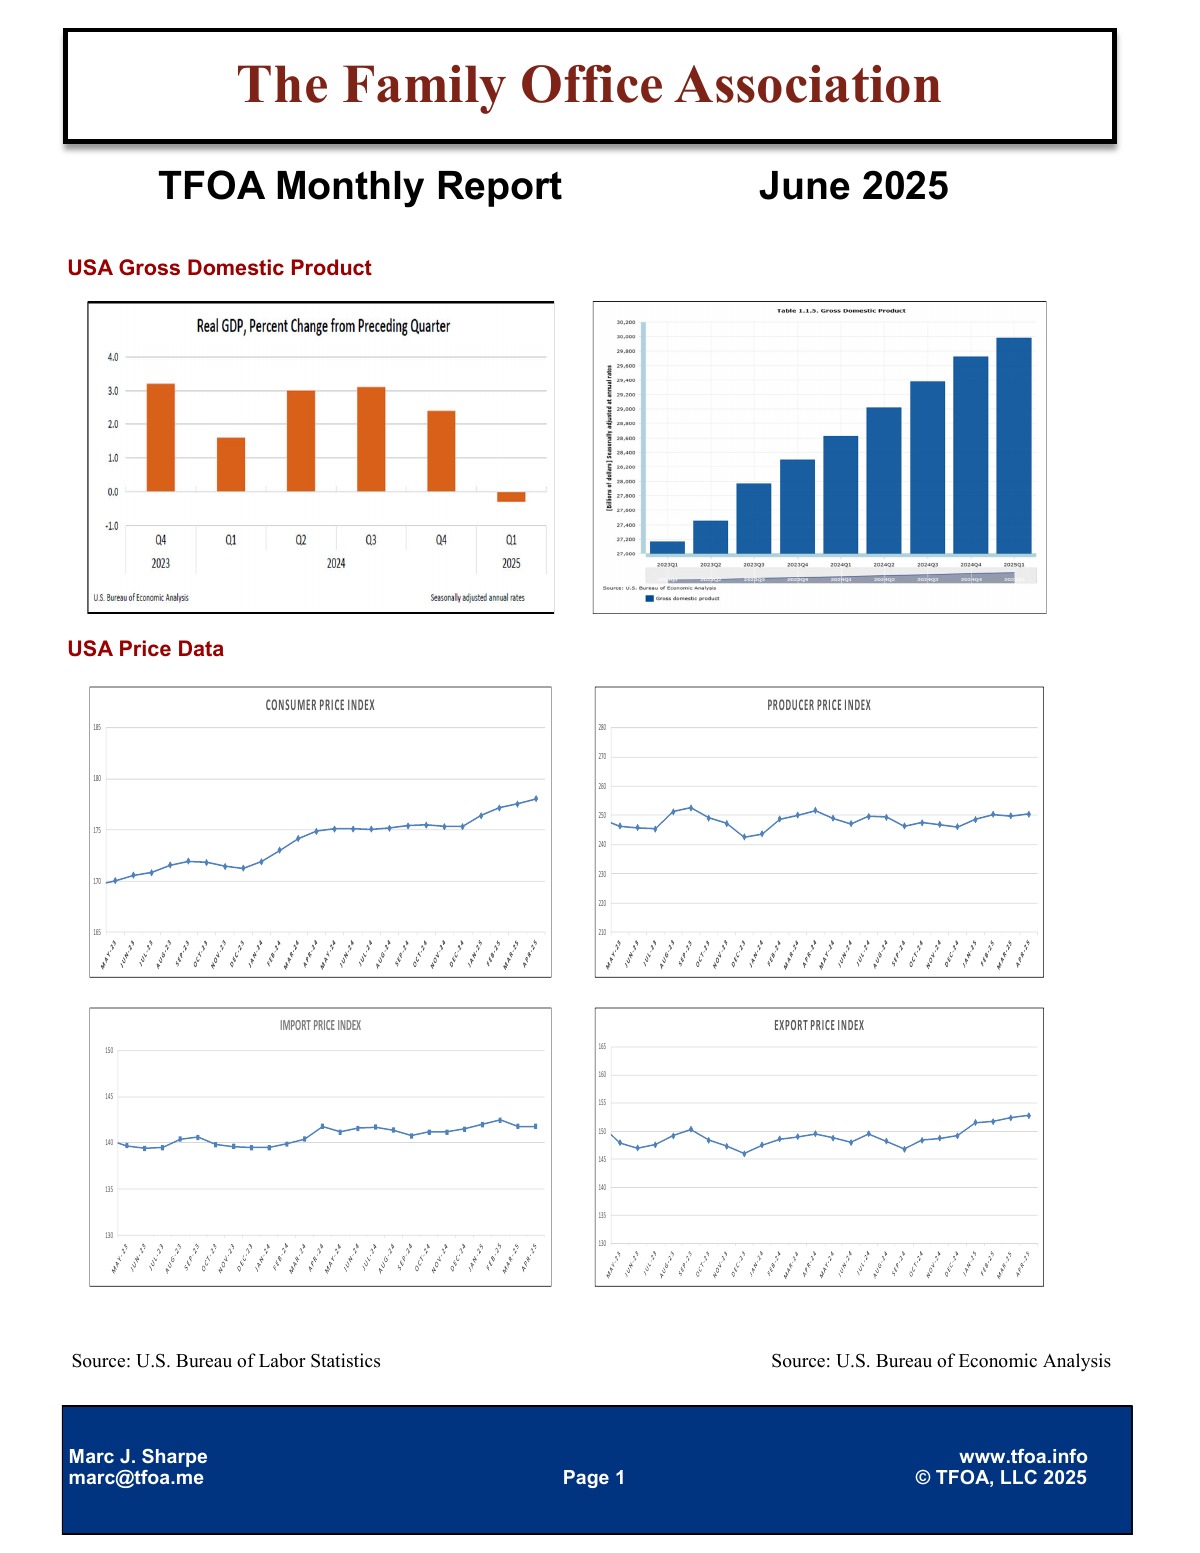
June 2025 — U.S. real GDP grew 3.8% in Q2 2025, with total output near $30.49 trillion. Consumer prices ran at 2.3% year over year (CPI 320.3), the Producer Price Index reached 147.7, and the import and export price indices stood at 141.7 and 152.6. The unemployment rate was 4.3%.
What did U.S. GDP do in the June 2025 TFOA Economic Update?
Real GDP grew 3.8% in Q2 2025, with total U.S. output near $30.49 trillion.
What was inflation in June 2025?
Consumer prices rose 2.3% year over year (CPI 320.3), and the Producer Price Index was 147.7.
What does the June 2025 TFOA Economic Update cover?
U.S. GDP, CPI, PPI, import and export price indices (141.7 and 152.6), the unemployment rate (4.3%), and selected state-level data for California, Florida, New York and Texas.
May 2025
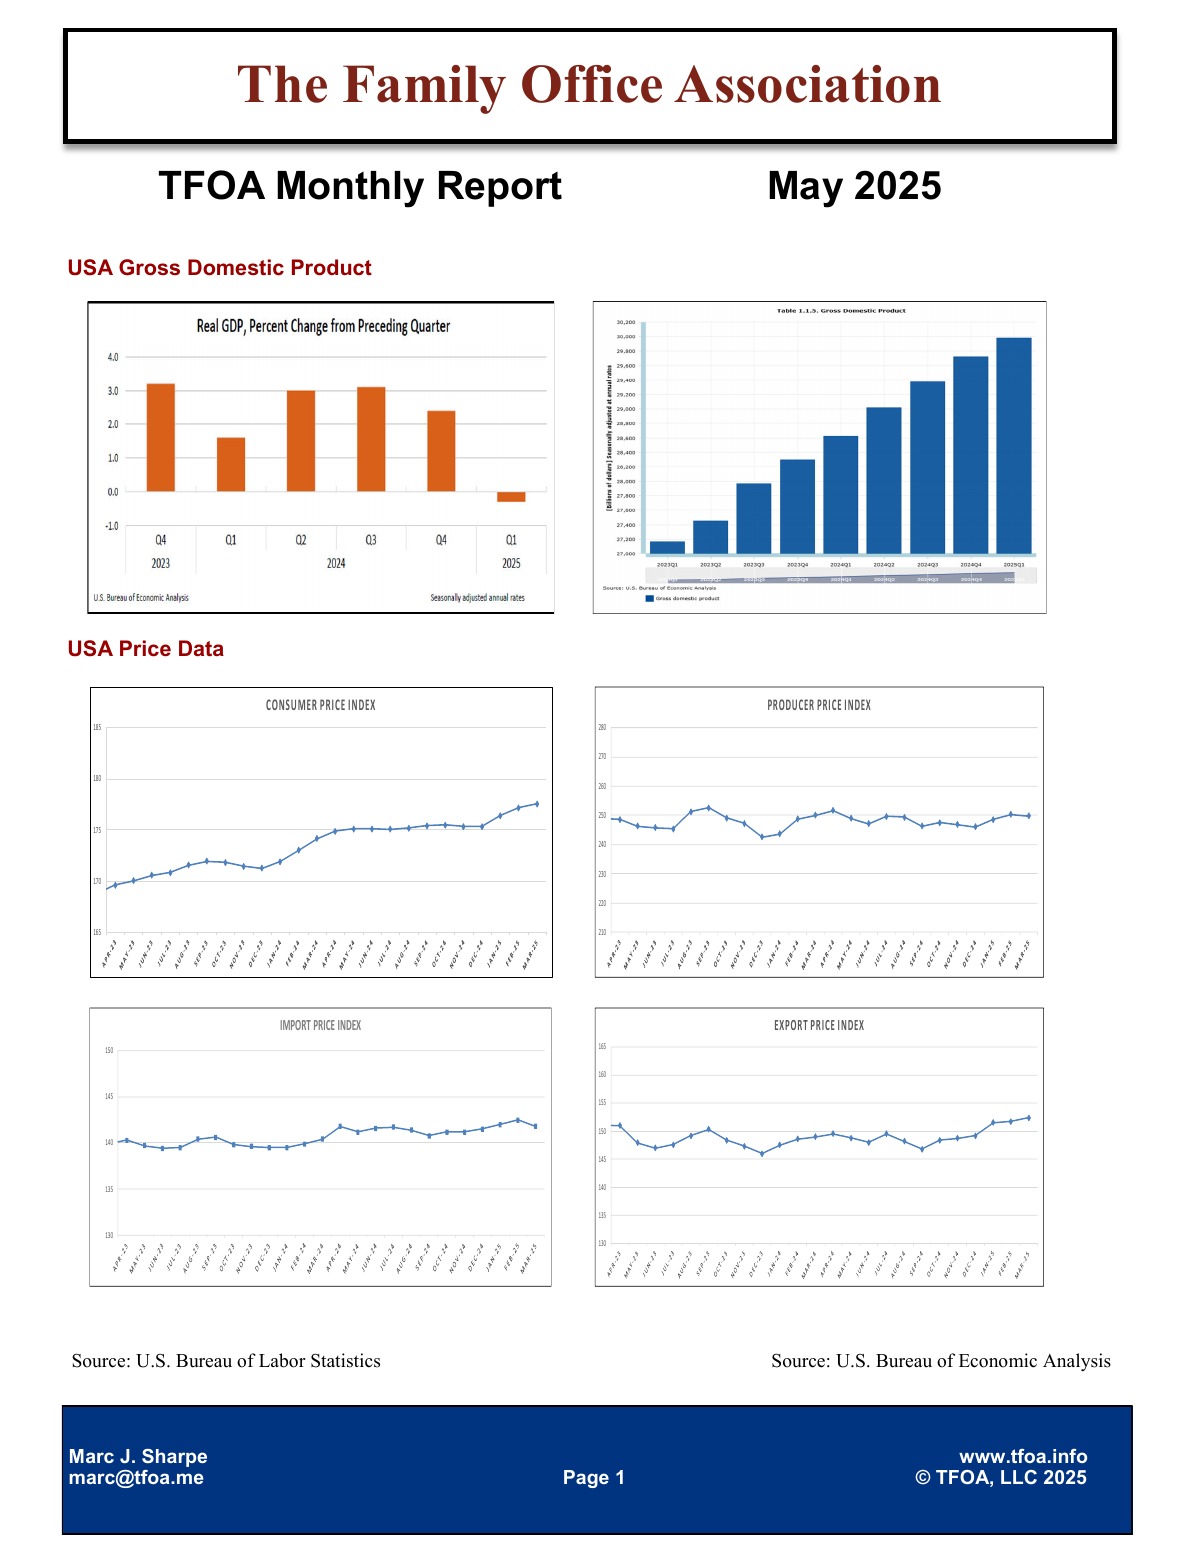
May 2025 — U.S. real GDP grew 3.8% in Q2 2025, with total output near $30.49 trillion. Consumer prices ran at 2.4% year over year (CPI 319.8), the Producer Price Index reached 148.1, and the import and export price indices stood at 141.6 and 152.5. The unemployment rate was 4.2%.
What did U.S. GDP do in the May 2025 TFOA Economic Update?
Real GDP grew 3.8% in Q2 2025, with total U.S. output near $30.49 trillion.
What was inflation in May 2025?
Consumer prices rose 2.4% year over year (CPI 319.8), and the Producer Price Index was 148.1.
What does the May 2025 TFOA Economic Update cover?
U.S. GDP, CPI, PPI, import and export price indices (141.6 and 152.5), the unemployment rate (4.2%), and selected state-level data for California, Florida, New York and Texas.
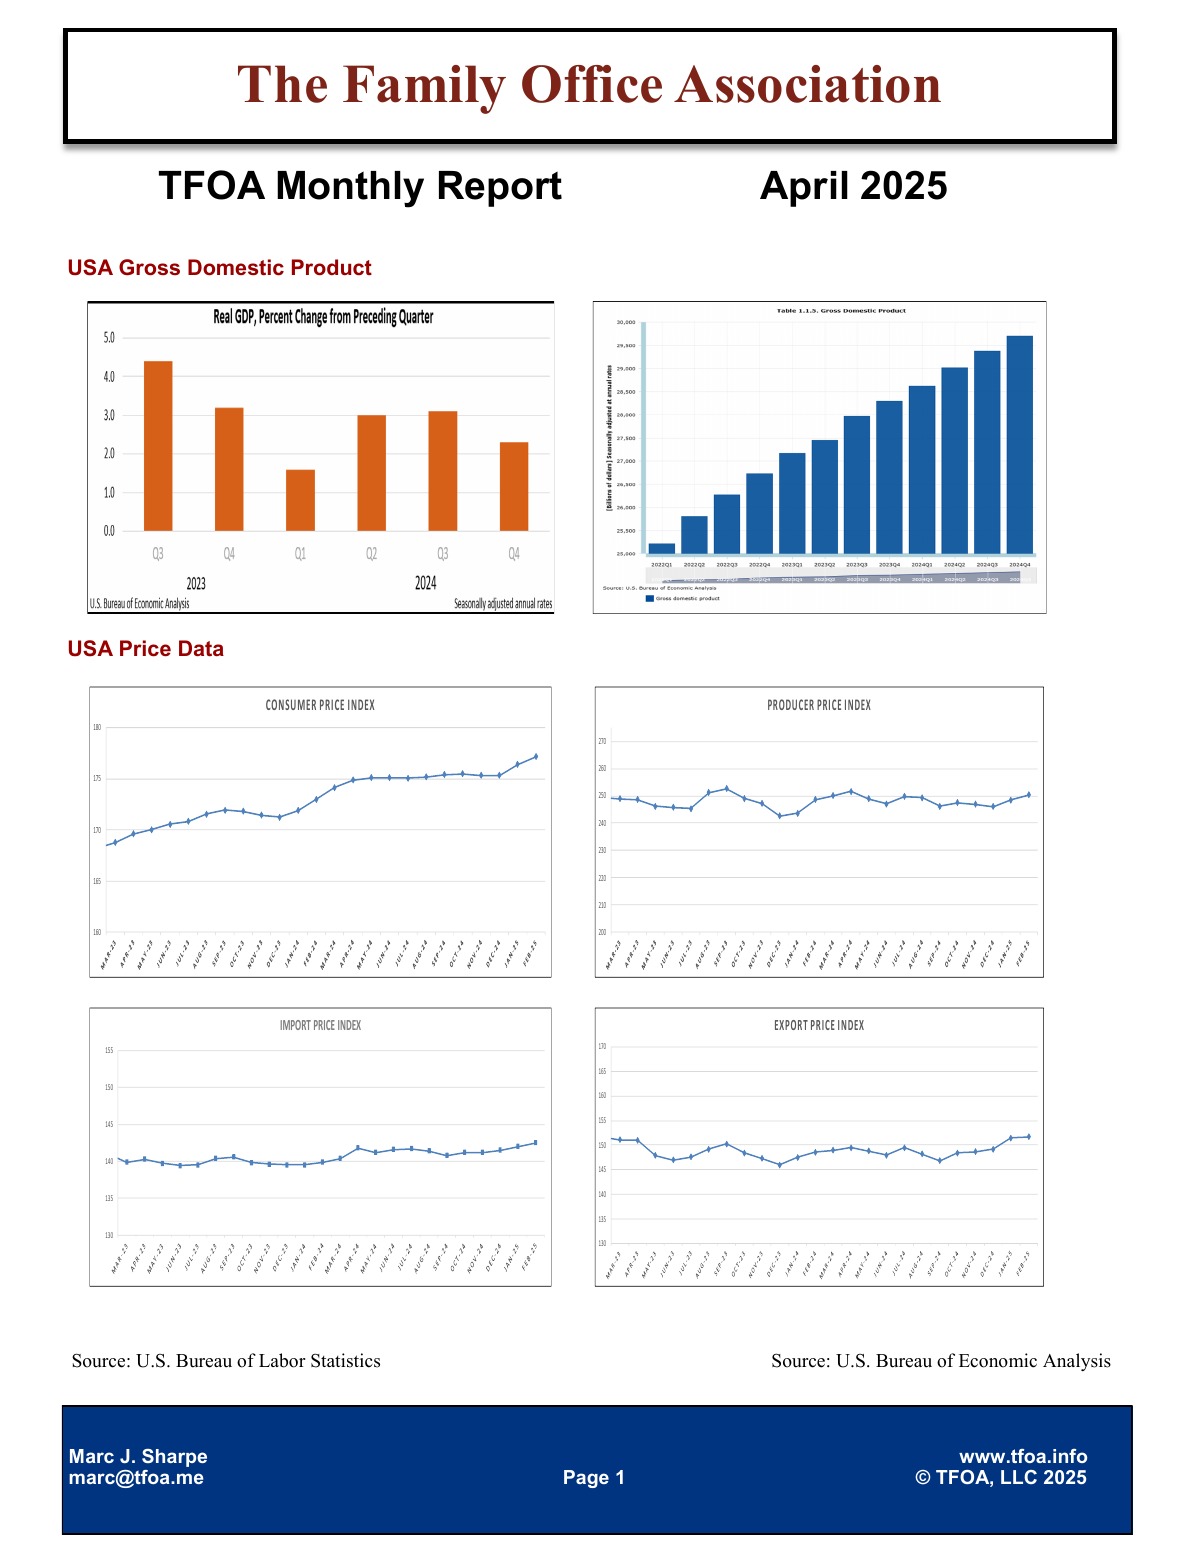
April 2025
April 2025 — U.S. real GDP contracted 0.6% in Q1 2025, with total output near $30.04 trillion. Consumer prices ran at 2.8% year over year (CPI 319.7), the Producer Price Index reached 148.2, and the import and export price indices stood at 142.1 and 152.6. The unemployment rate was 4.2%.
What did U.S. GDP do in the April 2025 TFOA Economic Update?
Real GDP contracted 0.6% in Q1 2025, with total U.S. output near $30.04 trillion.
What was inflation in April 2025?
Consumer prices rose 2.8% year over year (CPI 319.7), and the Producer Price Index was 148.2.
What does the April 2025 TFOA Economic Update cover?
U.S. GDP, CPI, PPI, import and export price indices (142.1 and 152.6), the unemployment rate (4.2%), and selected state-level data for California, Florida, New York and Texas.
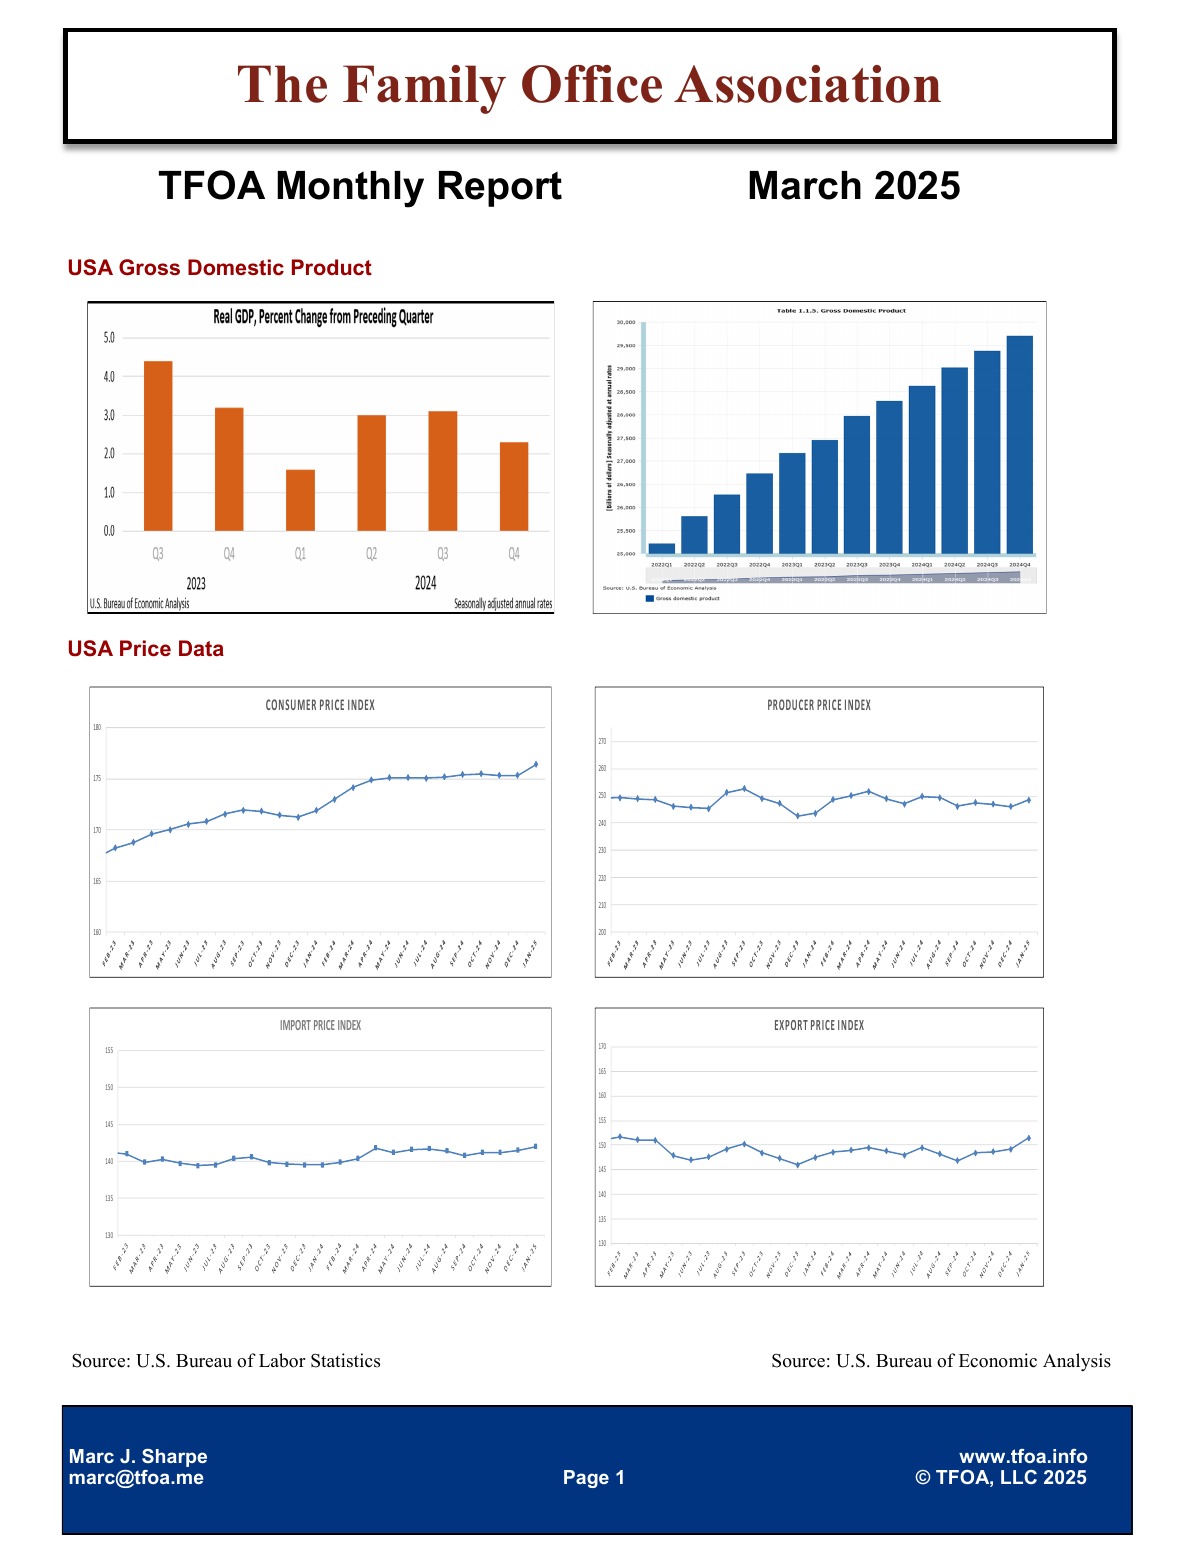
March 2025
March 2025 — U.S. real GDP contracted 0.6% in Q1 2025, with total output near $30.04 trillion. Consumer prices ran at 3% year over year (CPI 319.0), the Producer Price Index reached 148.0, and the import and export price indices stood at 141.8 and 151.6. The unemployment rate was 4.2%.
What did U.S. GDP do in the March 2025 TFOA Economic Update?
Real GDP contracted 0.6% in Q1 2025, with total U.S. output near $30.04 trillion.
What was inflation in March 2025?
Consumer prices rose 3% year over year (CPI 319.0), and the Producer Price Index was 148.0.
What does the March 2025 TFOA Economic Update cover?
U.S. GDP, CPI, PPI, import and export price indices (141.8 and 151.6), the unemployment rate (4.2%), and selected state-level data for California, Florida, New York and Texas.
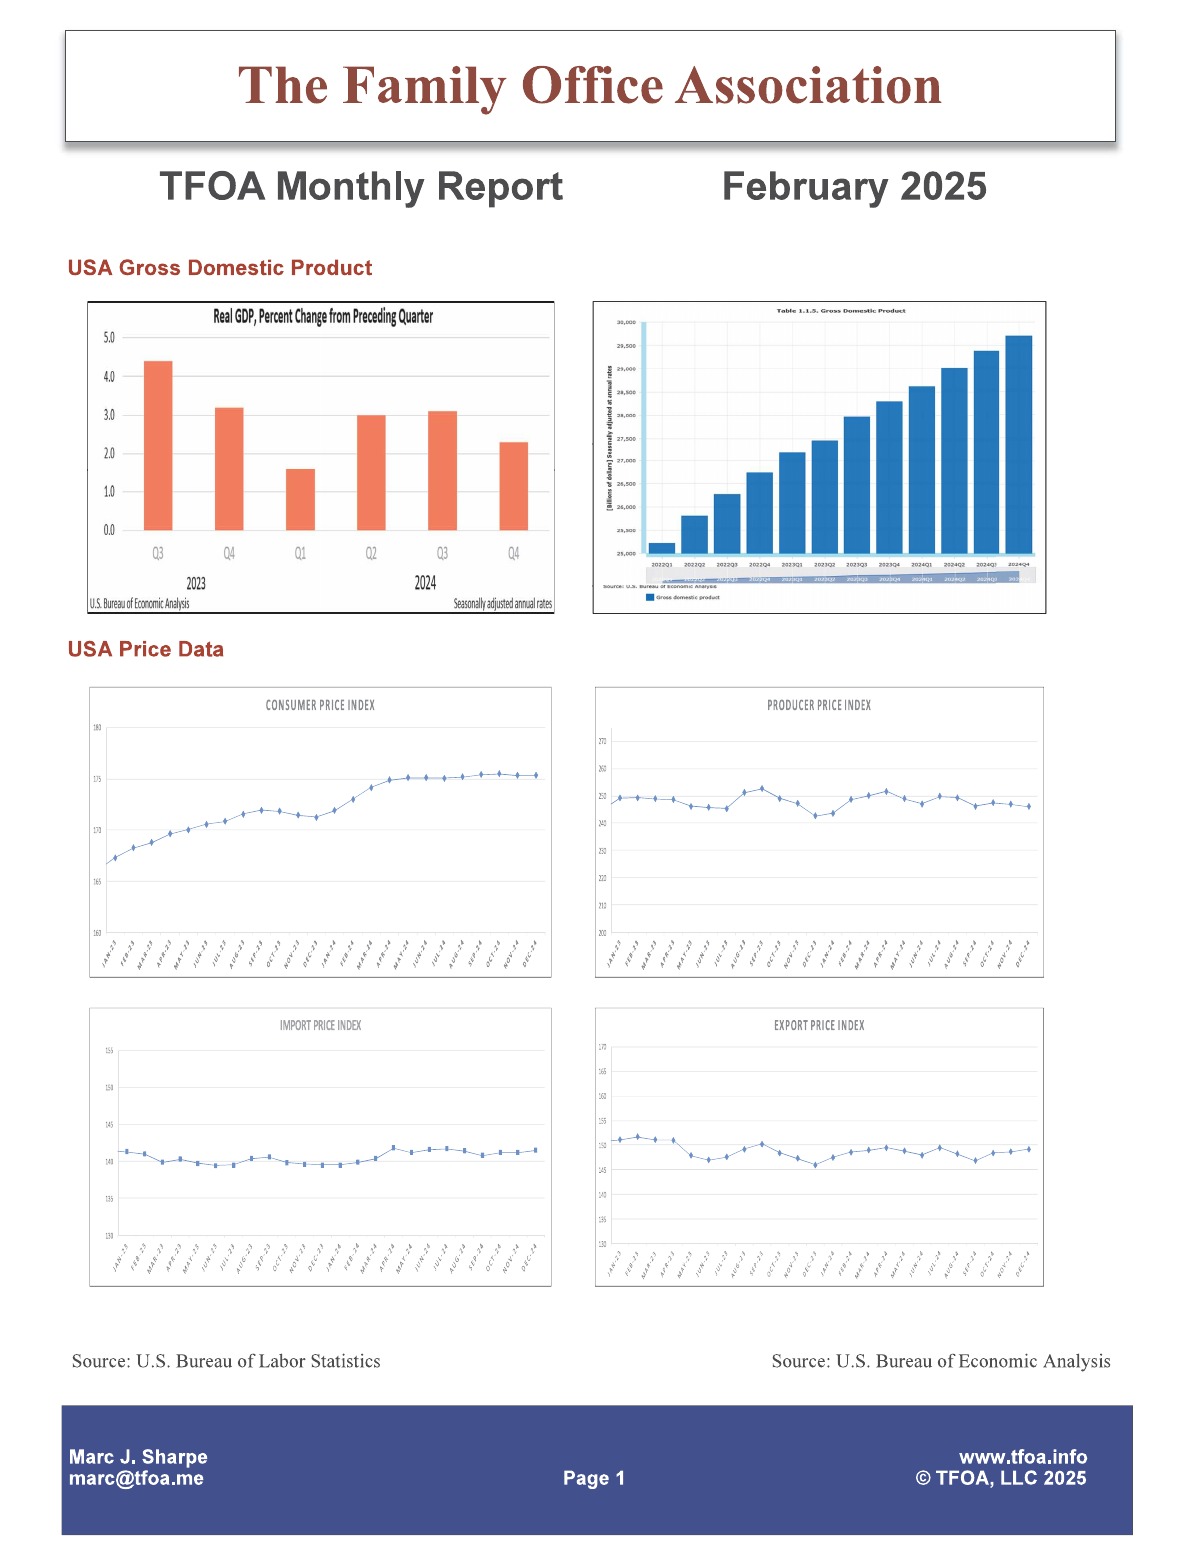
February 2025
February 2025 — U.S. real GDP contracted 0.6% in Q1 2025, with total output near $30.04 trillion. Consumer prices ran at 2.9% year over year (CPI 317.6), the Producer Price Index reached 147.1, and the import and export price indices stood at 141.4 and 149.5. The unemployment rate was 4%.
What did U.S. GDP do in the February 2025 TFOA Economic Update?
Real GDP contracted 0.6% in Q1 2025, with total U.S. output near $30.04 trillion.
What was inflation in February 2025?
Consumer prices rose 2.9% year over year (CPI 317.6), and the Producer Price Index was 147.1.
What does the February 2025 TFOA Economic Update cover?
U.S. GDP, CPI, PPI, import and export price indices (141.4 and 149.5), the unemployment rate (4%), and selected state-level data for California, Florida, New York and Texas.
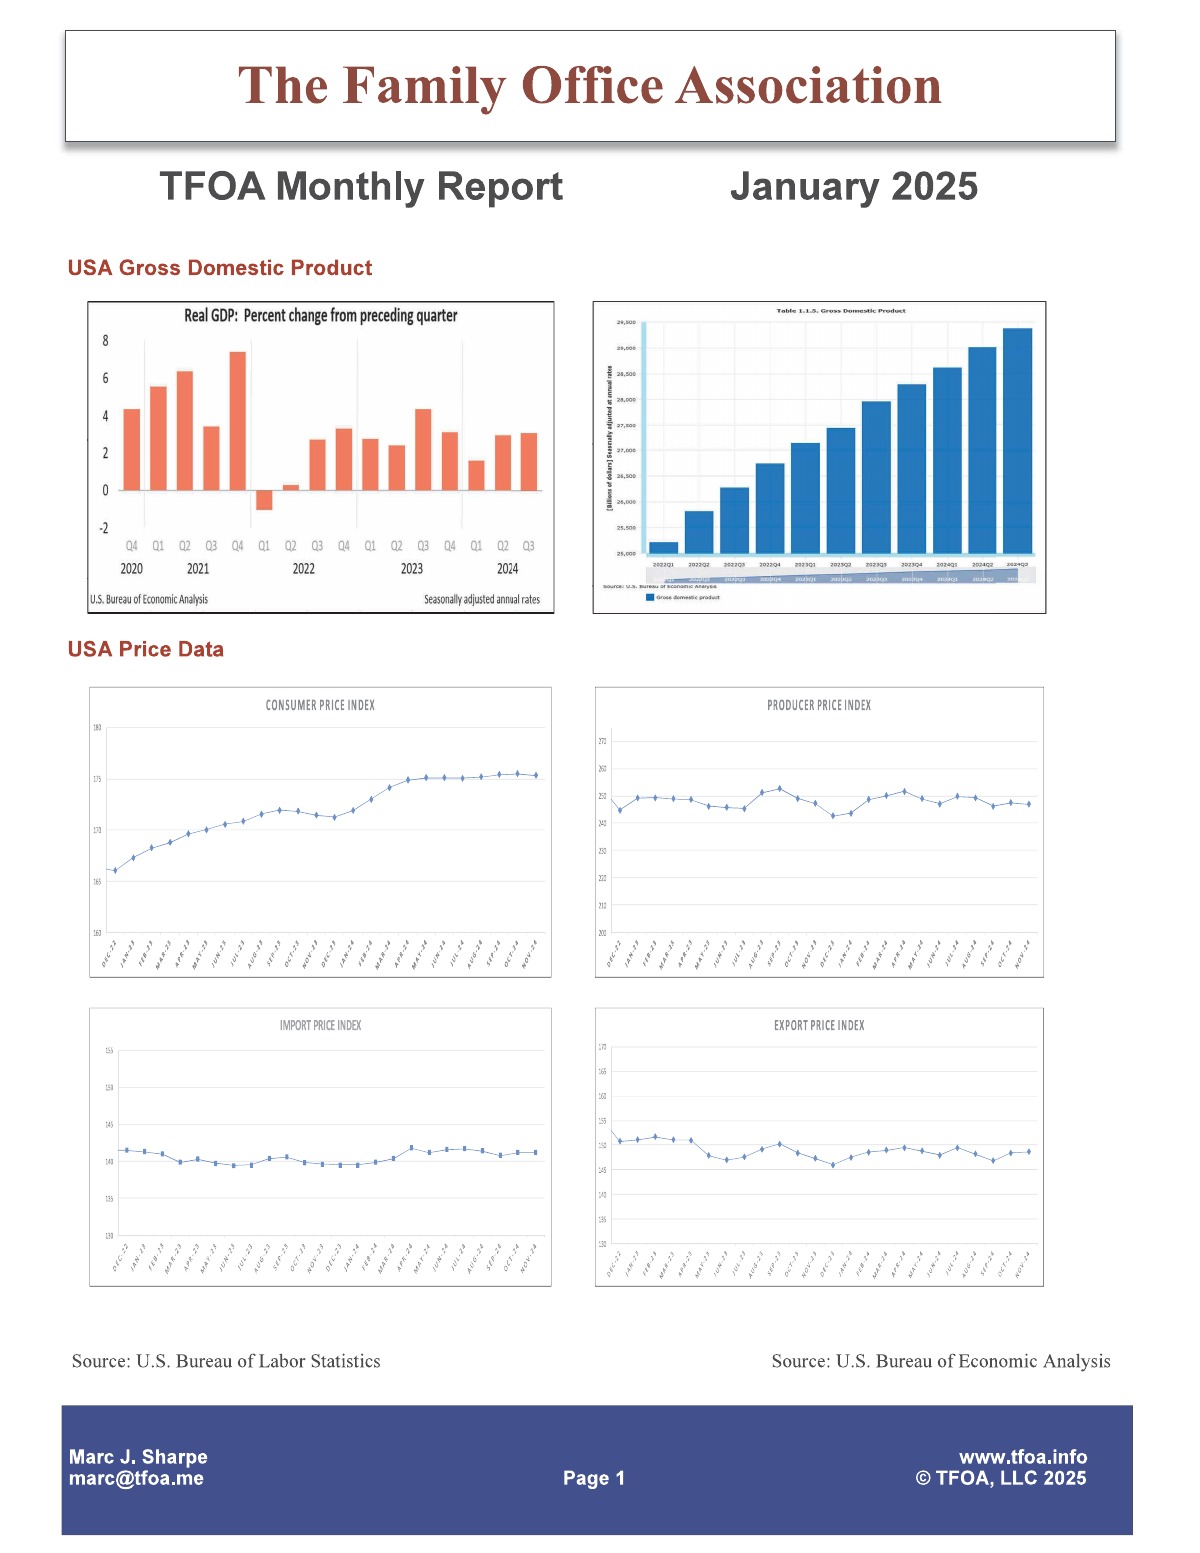
January 2025
January 2025 — U.S. real GDP grew 1.9% in Q4 2024, with total output near $29.83 trillion. Consumer prices ran at 2.7% year over year (CPI 316.5), the Producer Price Index reached 146.4, and the import and export price indices stood at 141.3 and 148.8. The unemployment rate was 4.1%.
What did U.S. GDP do in the January 2025 TFOA Economic Update?
Real GDP grew 1.9% in Q4 2024, with total U.S. output near $29.83 trillion.
What was inflation in January 2025?
Consumer prices rose 2.7% year over year (CPI 316.5), and the Producer Price Index was 146.4.
What does the January 2025 TFOA Economic Update cover?
U.S. GDP, CPI, PPI, import and export price indices (141.3 and 148.8), the unemployment rate (4.1%), and selected state-level data for California, Florida, New York and Texas.
December 2024
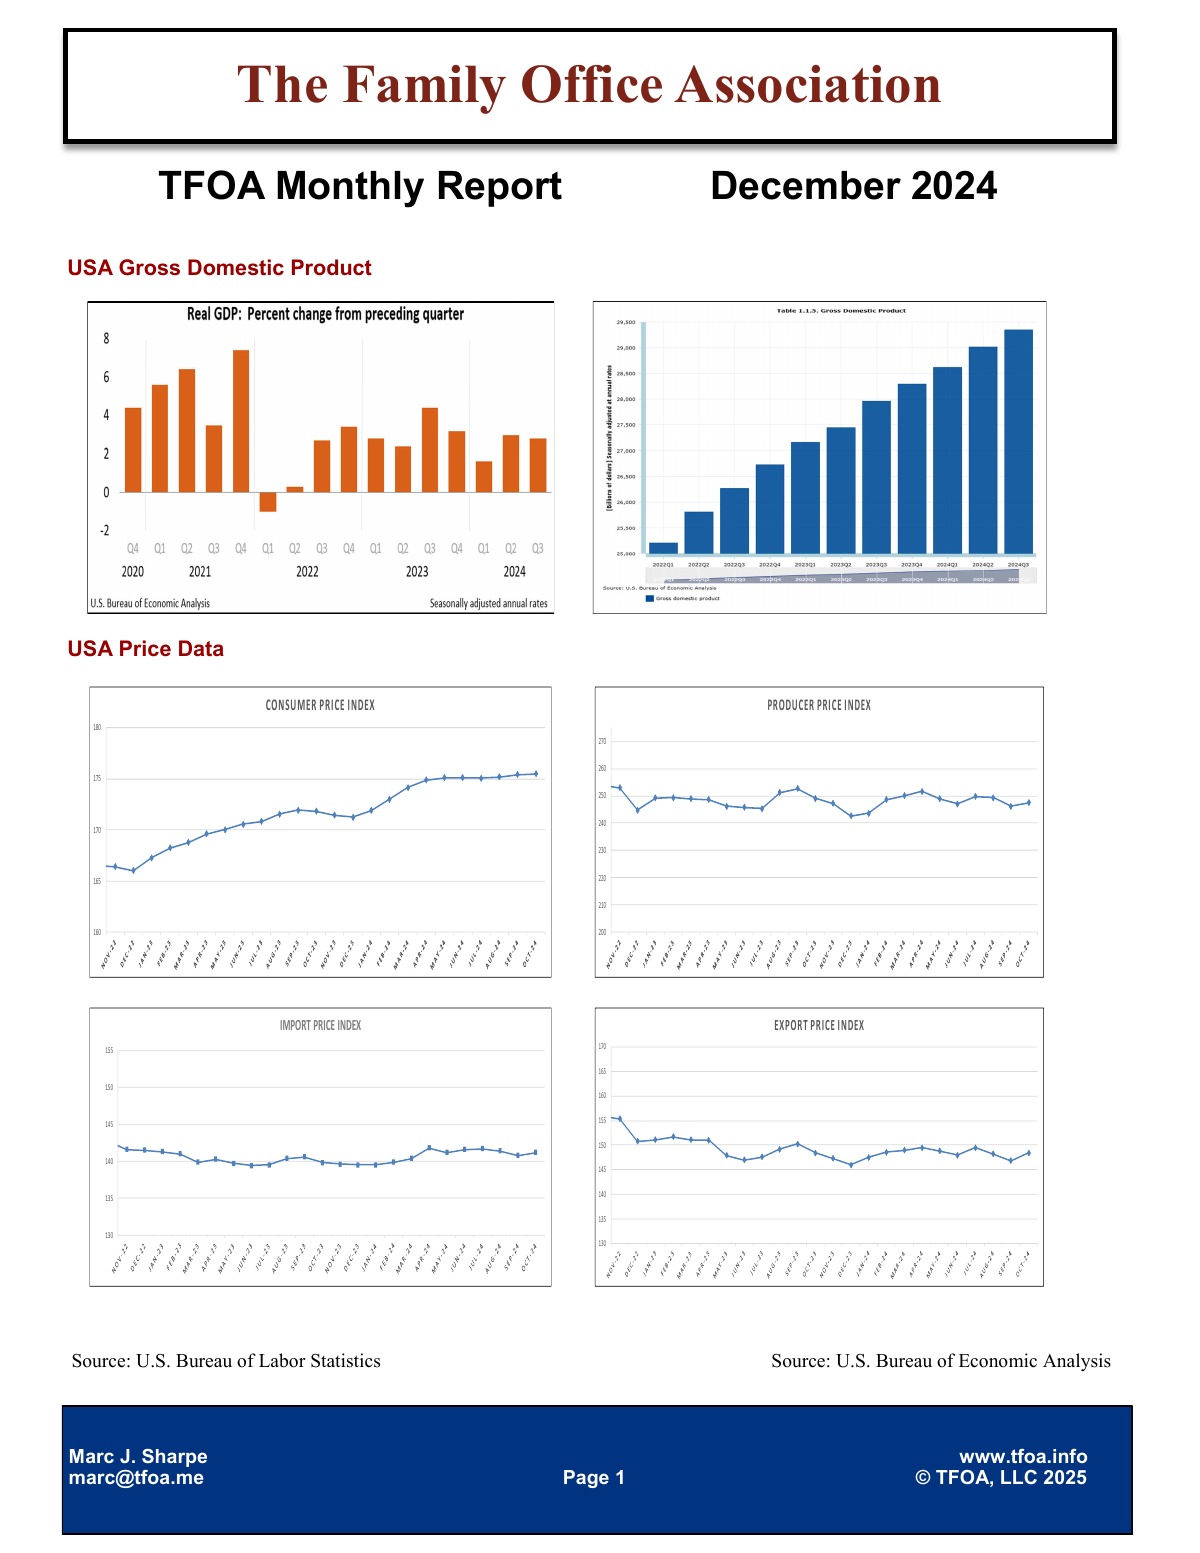
December 2024 — U.S. real GDP grew 1.9% in Q4 2024, with total output near $29.83 trillion. Consumer prices ran at 2.6% year over year (CPI 315.6), the Producer Price Index reached 146.3, and the import and export price indices stood at 141.1 and 148.8. The unemployment rate was 4.2%.
What did U.S. GDP do in the December 2024 TFOA Economic Update?
Real GDP grew 1.9% in Q4 2024, with total U.S. output near $29.83 trillion.
What was inflation in December 2024?
Consumer prices rose 2.6% year over year (CPI 315.6), and the Producer Price Index was 146.3.
What does the December 2024 TFOA Economic Update cover?
U.S. GDP, CPI, PPI, import and export price indices (141.1 and 148.8), the unemployment rate (4.2%), and selected state-level data for California, Florida, New York and Texas.
November 2024
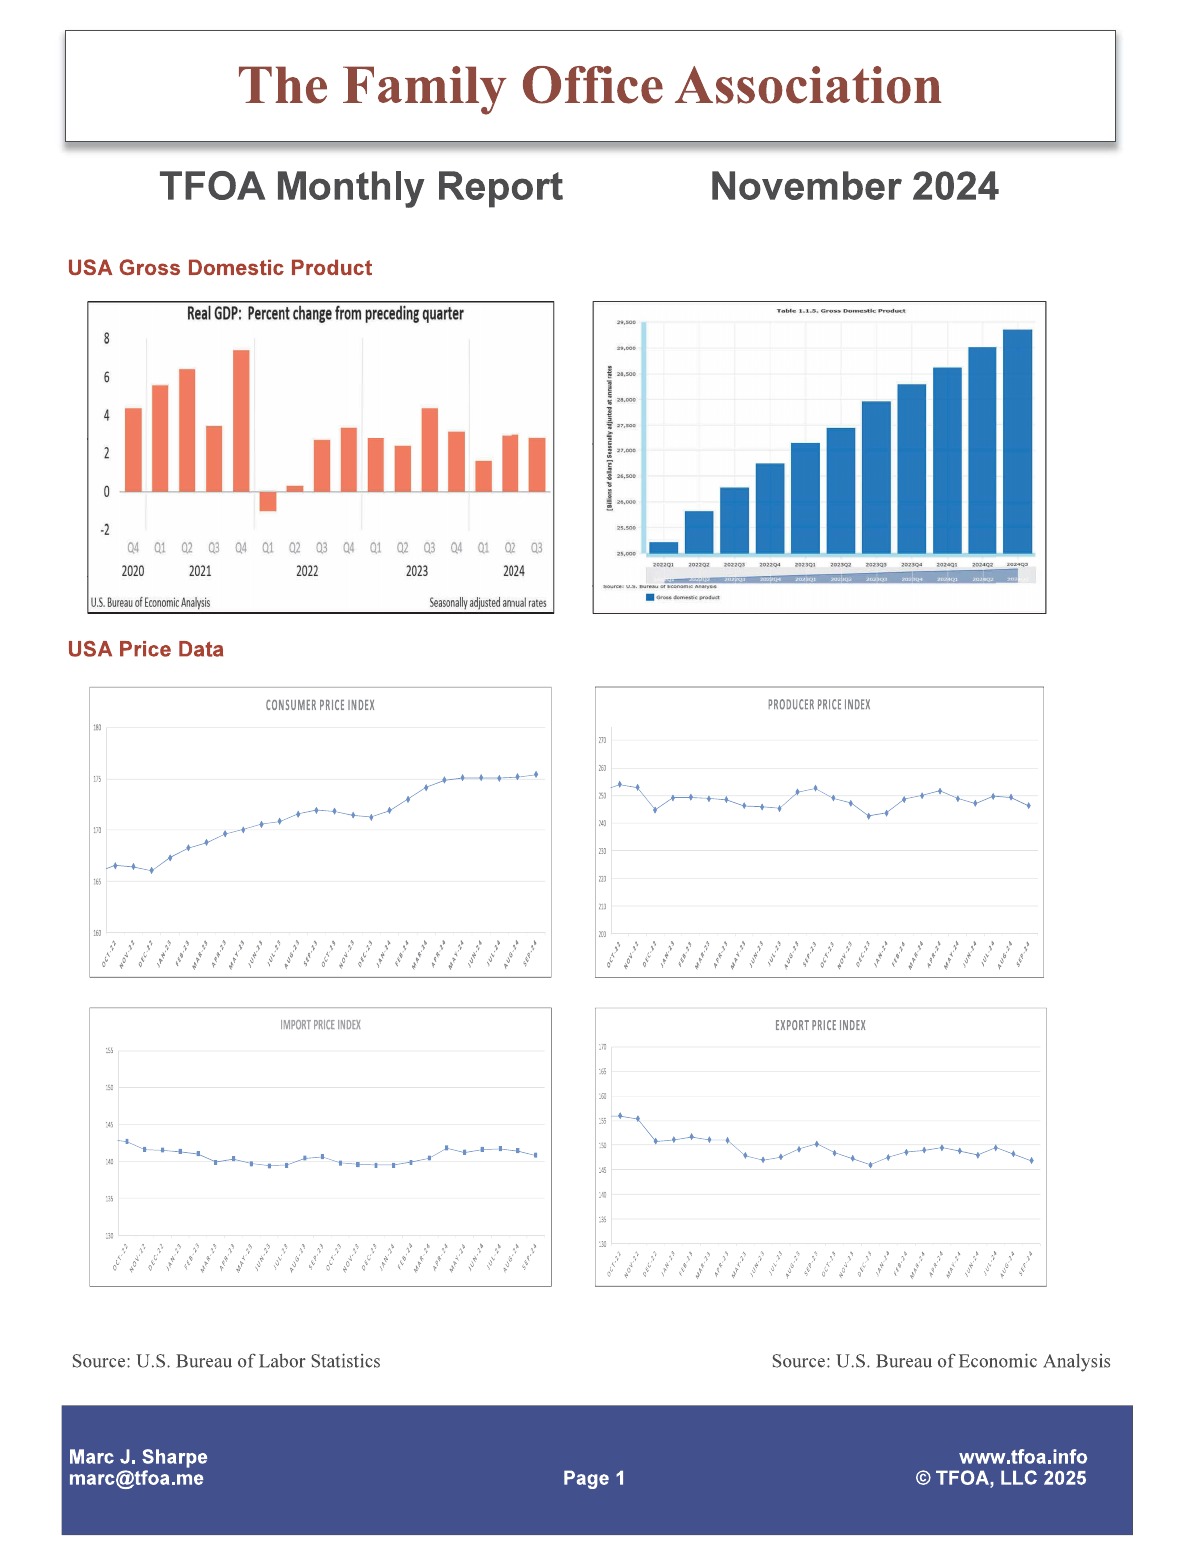
November 2024 — U.S. real GDP grew 1.9% in Q4 2024, with total output near $29.83 trillion. Consumer prices ran at 2.4% year over year (CPI 314.7), the Producer Price Index reached 145.8, and the import and export price indices stood at 140.9 and 147.3. The unemployment rate was 4.1%.
What did U.S. GDP do in the November 2024 TFOA Economic Update?
Real GDP grew 1.9% in Q4 2024, with total U.S. output near $29.83 trillion.
What was inflation in November 2024?
Consumer prices rose 2.4% year over year (CPI 314.7), and the Producer Price Index was 145.8.
What does the November 2024 TFOA Economic Update cover?
U.S. GDP, CPI, PPI, import and export price indices (140.9 and 147.3), the unemployment rate (4.1%), and selected state-level data for California, Florida, New York and Texas.
October 2024
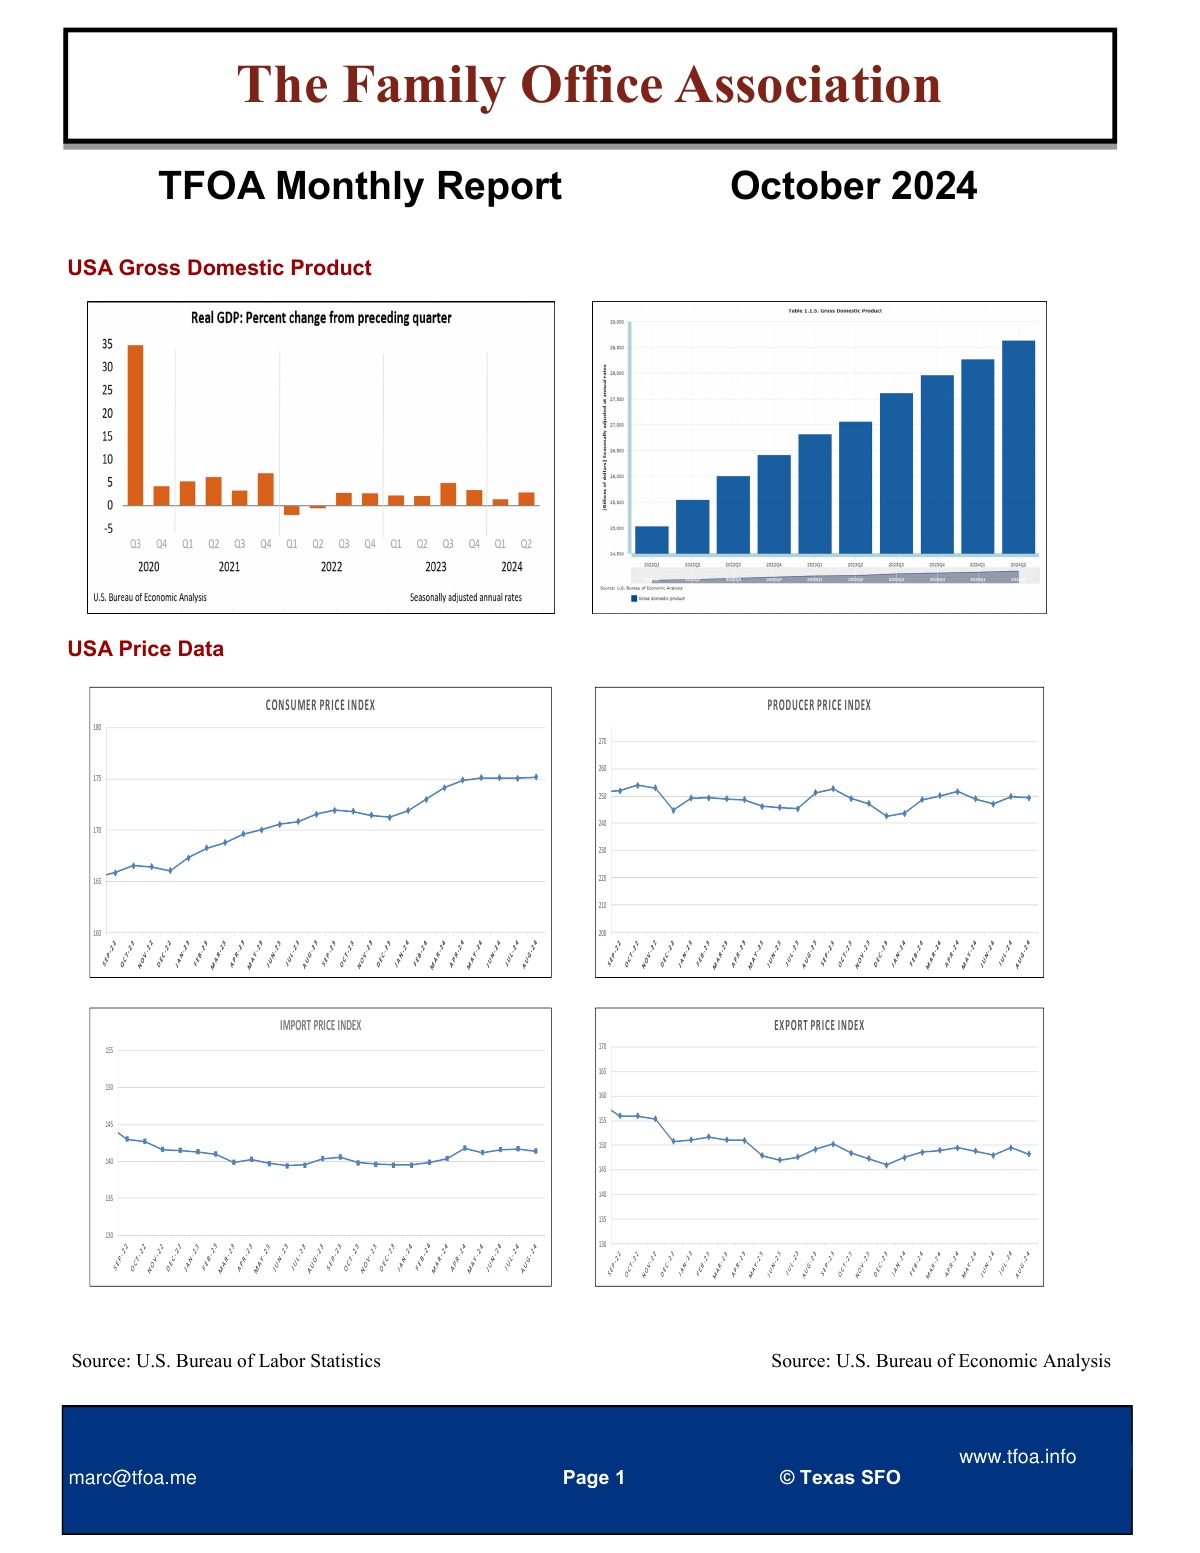
October 2024 — U.S. real GDP grew 3.3% in Q3 2024, with total output near $29.51 trillion. Consumer prices ran at 2.6% year over year (CPI 314.1), the Producer Price Index reached 145.4, and the import and export price indices stood at 141.4 and 148.2. The unemployment rate was 4.1%.
What did U.S. GDP do in the October 2024 TFOA Economic Update?
Real GDP grew 3.3% in Q3 2024, with total U.S. output near $29.51 trillion.
What was inflation in October 2024?
Consumer prices rose 2.6% year over year (CPI 314.1), and the Producer Price Index was 145.4.
What does the October 2024 TFOA Economic Update cover?
U.S. GDP, CPI, PPI, import and export price indices (141.4 and 148.2), the unemployment rate (4.1%), and selected state-level data for California, Florida, New York and Texas.
September 2024
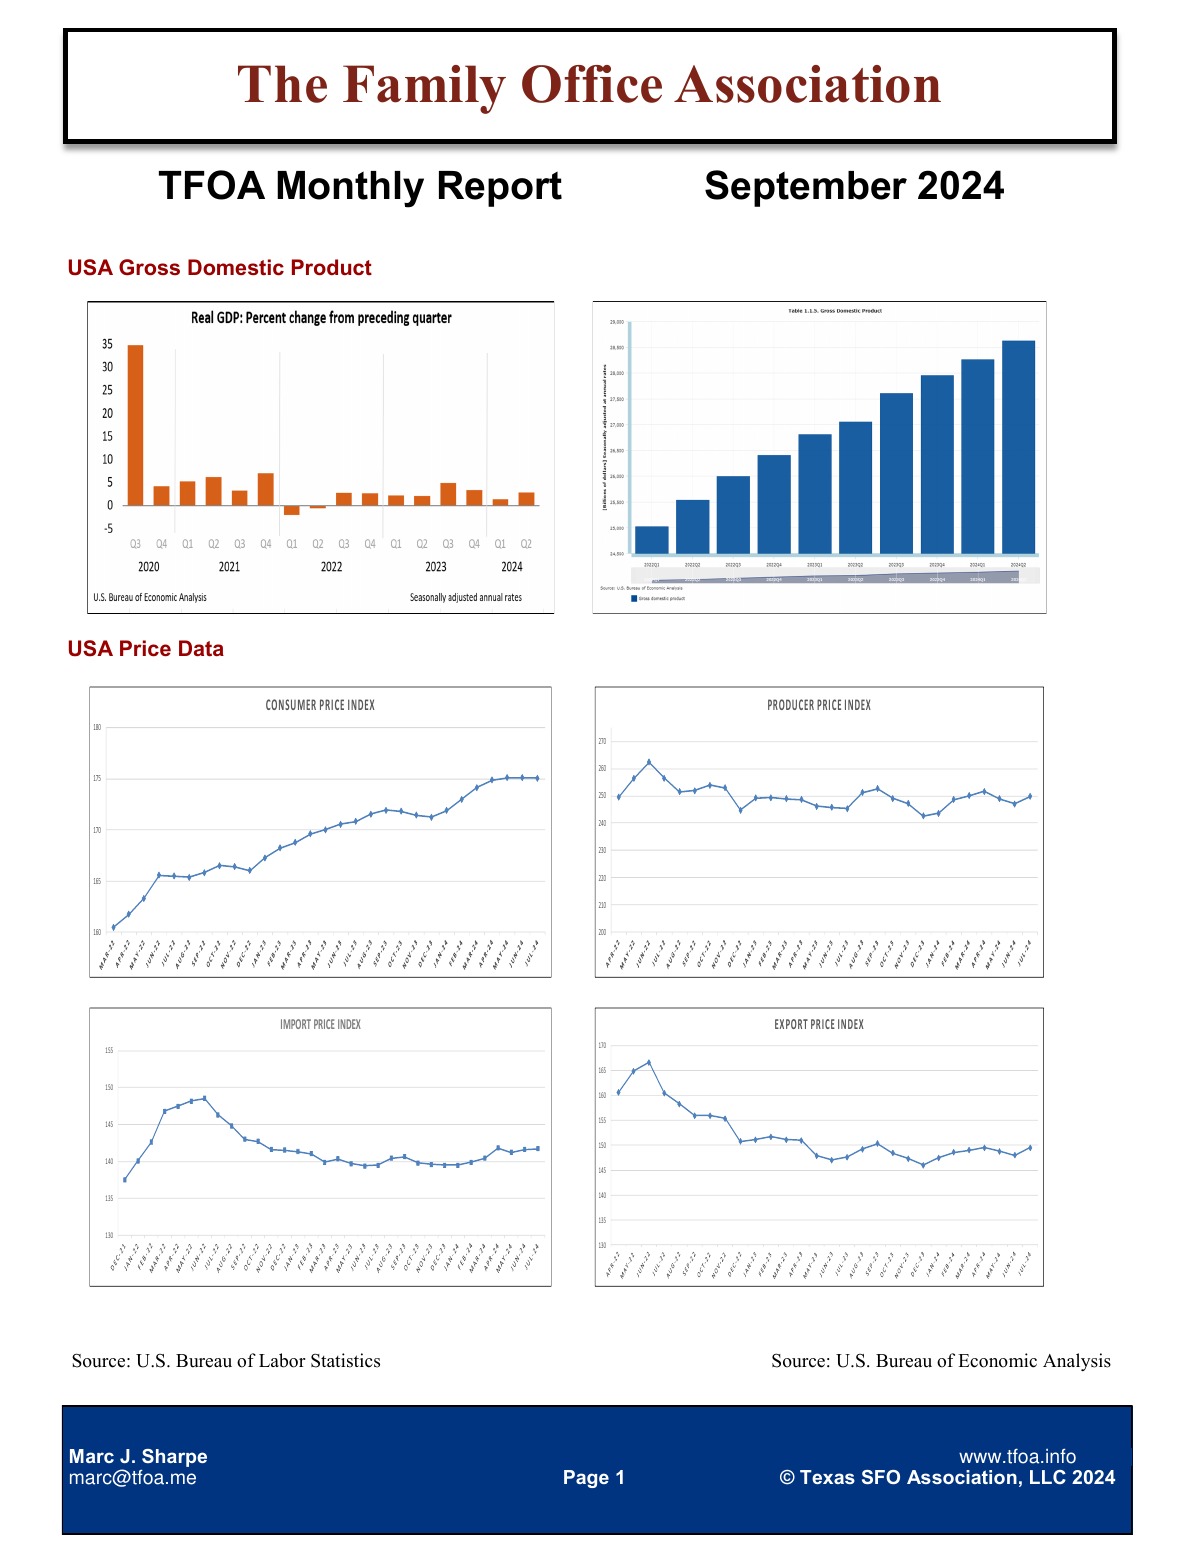
September 2024 — U.S. real GDP grew 3.3% in Q3 2024, with total output near $29.51 trillion. Consumer prices ran at 2.9% year over year (CPI 313.6), the Producer Price Index reached 144.9, and the import and export price indices stood at 141.8 and 149.2. The unemployment rate was 4.2%.
What did U.S. GDP do in the September 2024 TFOA Economic Update?
Real GDP grew 3.3% in Q3 2024, with total U.S. output near $29.51 trillion.
What was inflation in September 2024?
Consumer prices rose 2.9% year over year (CPI 313.6), and the Producer Price Index was 144.9.
What does the September 2024 TFOA Economic Update cover?
U.S. GDP, CPI, PPI, import and export price indices (141.8 and 149.2), the unemployment rate (4.2%), and selected state-level data for California, Florida, New York and Texas.
August 2024
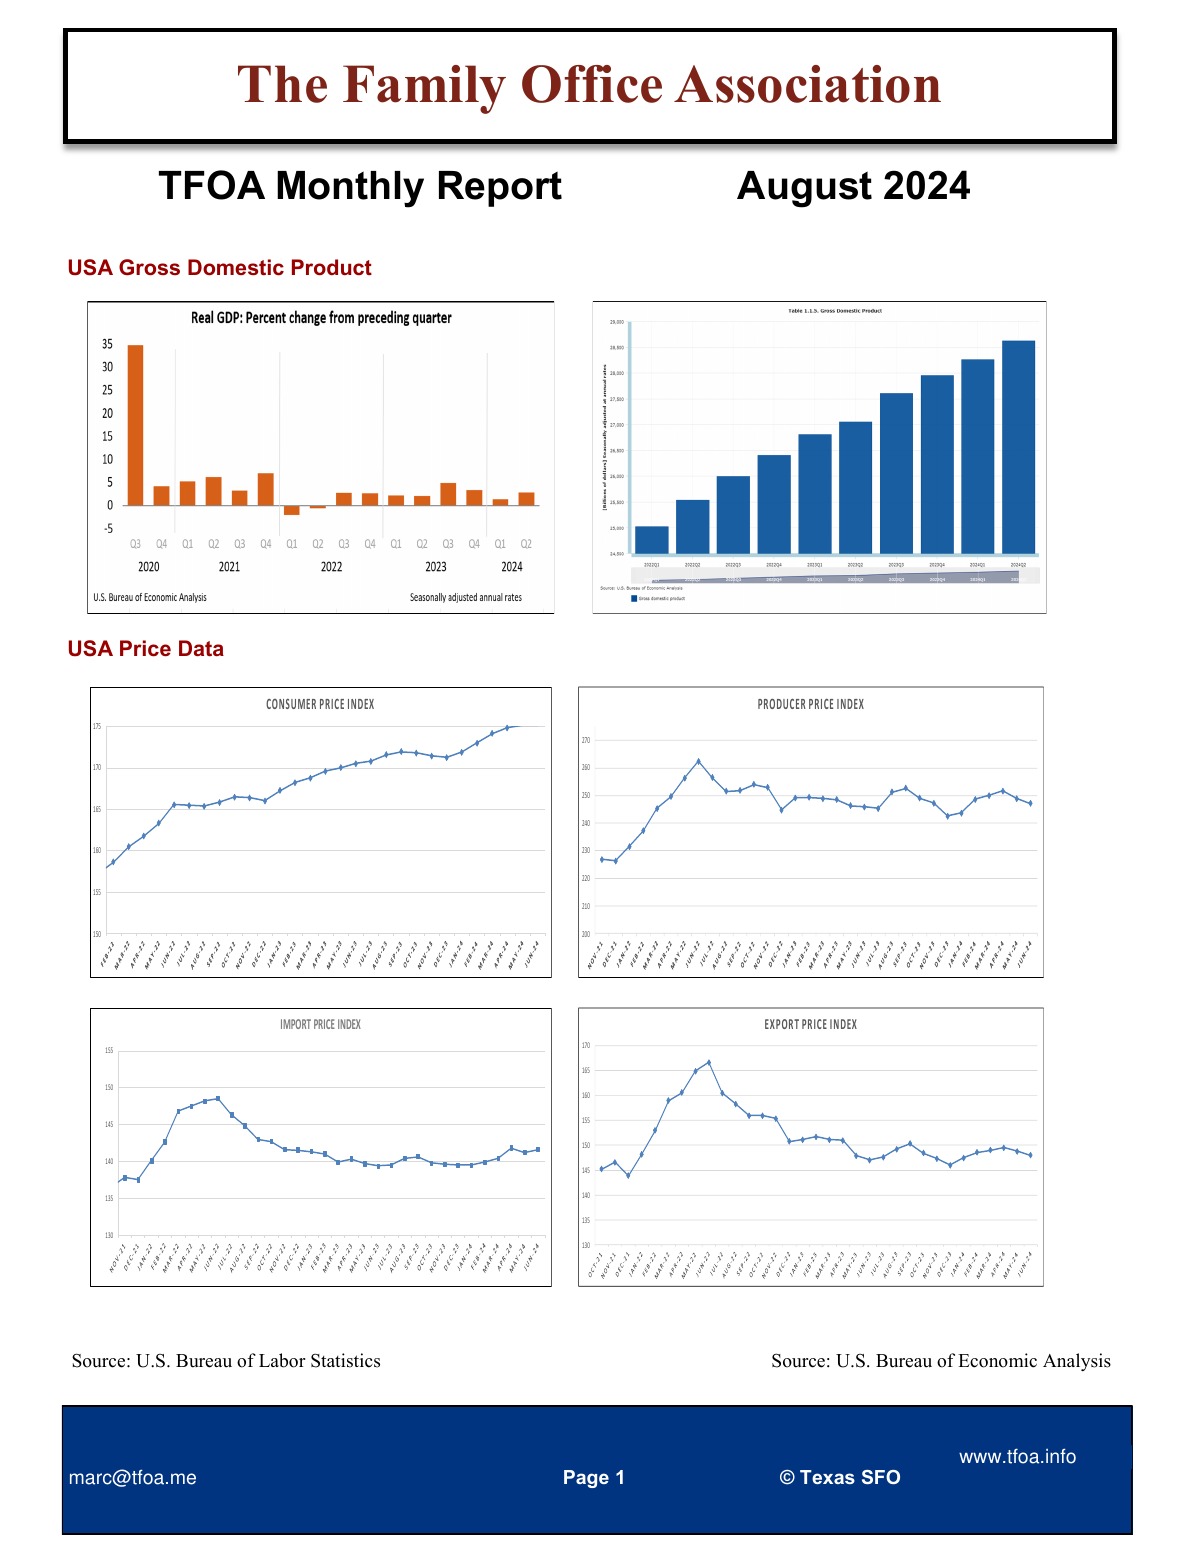
August 2024 — U.S. real GDP grew 3.3% in Q3 2024, with total output near $29.51 trillion. Consumer prices ran at 3% year over year (CPI 313.0), the Producer Price Index reached 144.9, and the import and export price indices stood at 141.6 and 148.4. The unemployment rate was 4.2%.
What did U.S. GDP do in the August 2024 TFOA Economic Update?
Real GDP grew 3.3% in Q3 2024, with total U.S. output near $29.51 trillion.
What was inflation in August 2024?
Consumer prices rose 3% year over year (CPI 313.0), and the Producer Price Index was 144.9.
What does the August 2024 TFOA Economic Update cover?
U.S. GDP, CPI, PPI, import and export price indices (141.6 and 148.4), the unemployment rate (4.2%), and selected state-level data for California, Florida, New York and Texas.
July 2024
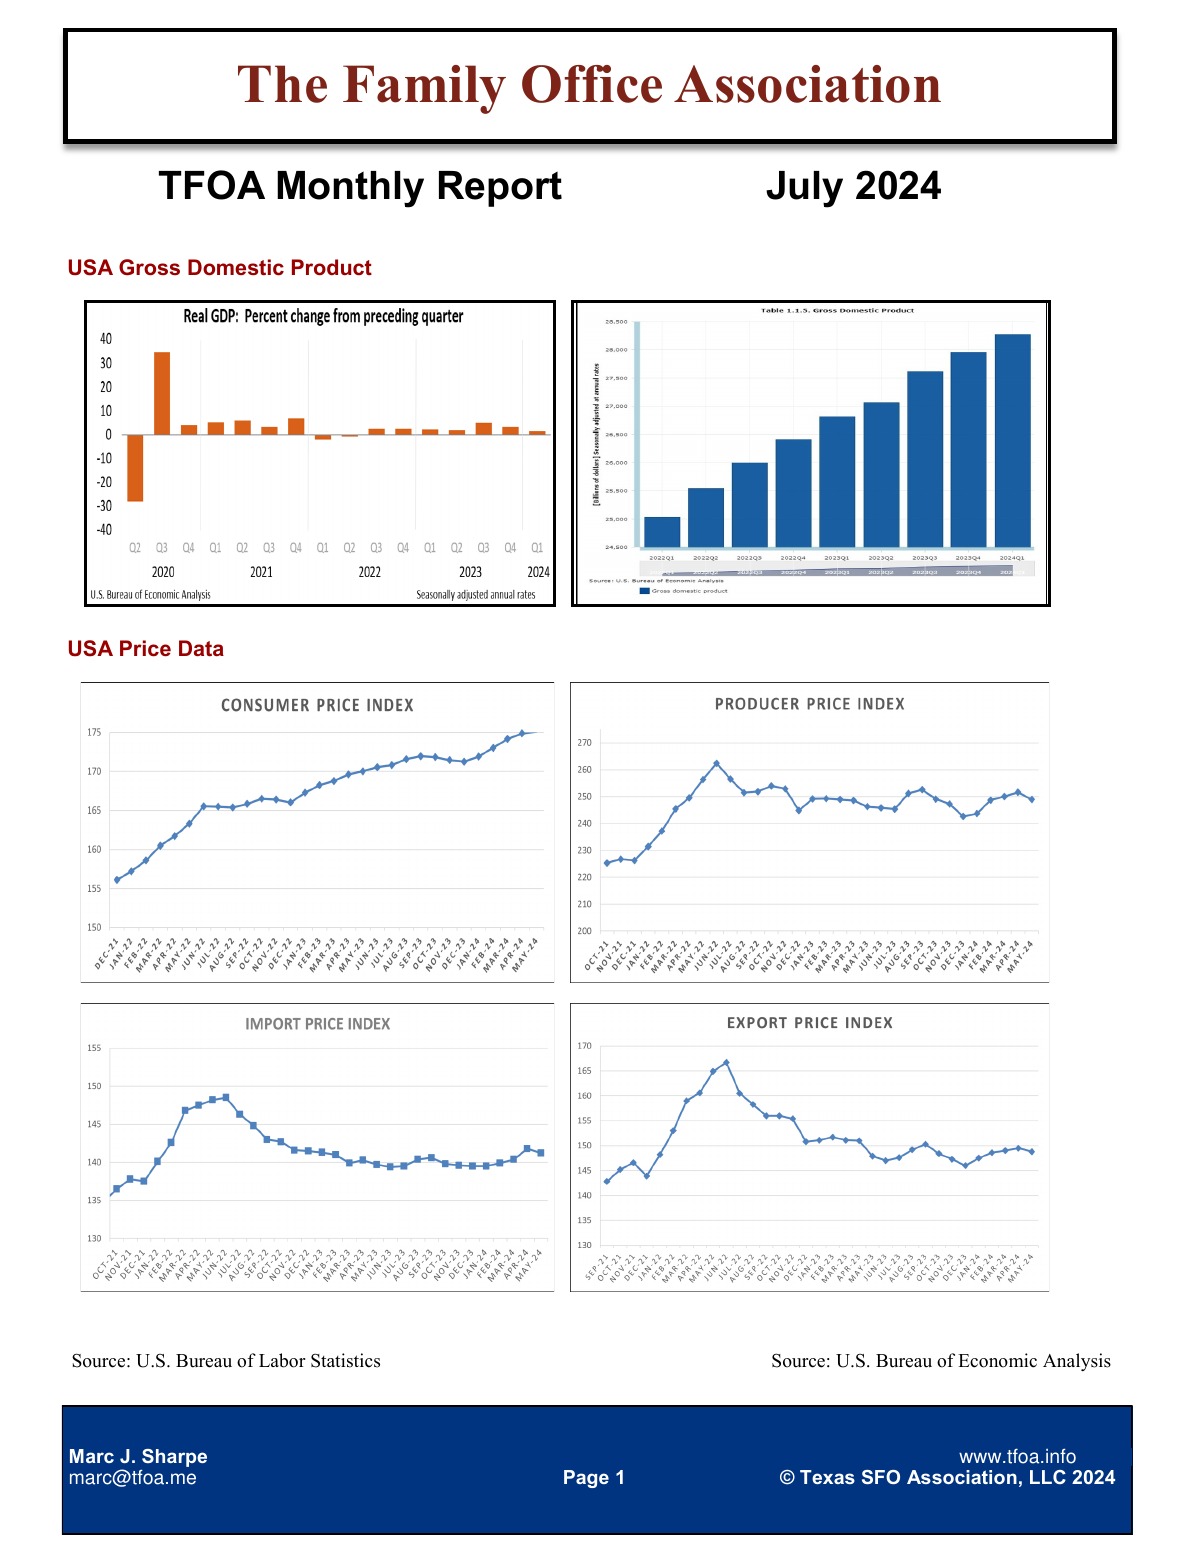
July 2024 — U.S. real GDP grew 3.6% in Q2 2024, with total output near $29.15 trillion. Consumer prices ran at 3.2% year over year (CPI 313.2), the Producer Price Index reached 144.2, and the import and export price indices stood at 141.5 and 148.8. The unemployment rate was 4.1%.
What did U.S. GDP do in the July 2024 TFOA Economic Update?
Real GDP grew 3.6% in Q2 2024, with total U.S. output near $29.15 trillion.
What was inflation in July 2024?
Consumer prices rose 3.2% year over year (CPI 313.2), and the Producer Price Index was 144.2.
What does the July 2024 TFOA Economic Update cover?
U.S. GDP, CPI, PPI, import and export price indices (141.5 and 148.8), the unemployment rate (4.1%), and selected state-level data for California, Florida, New York and Texas.
June 2024
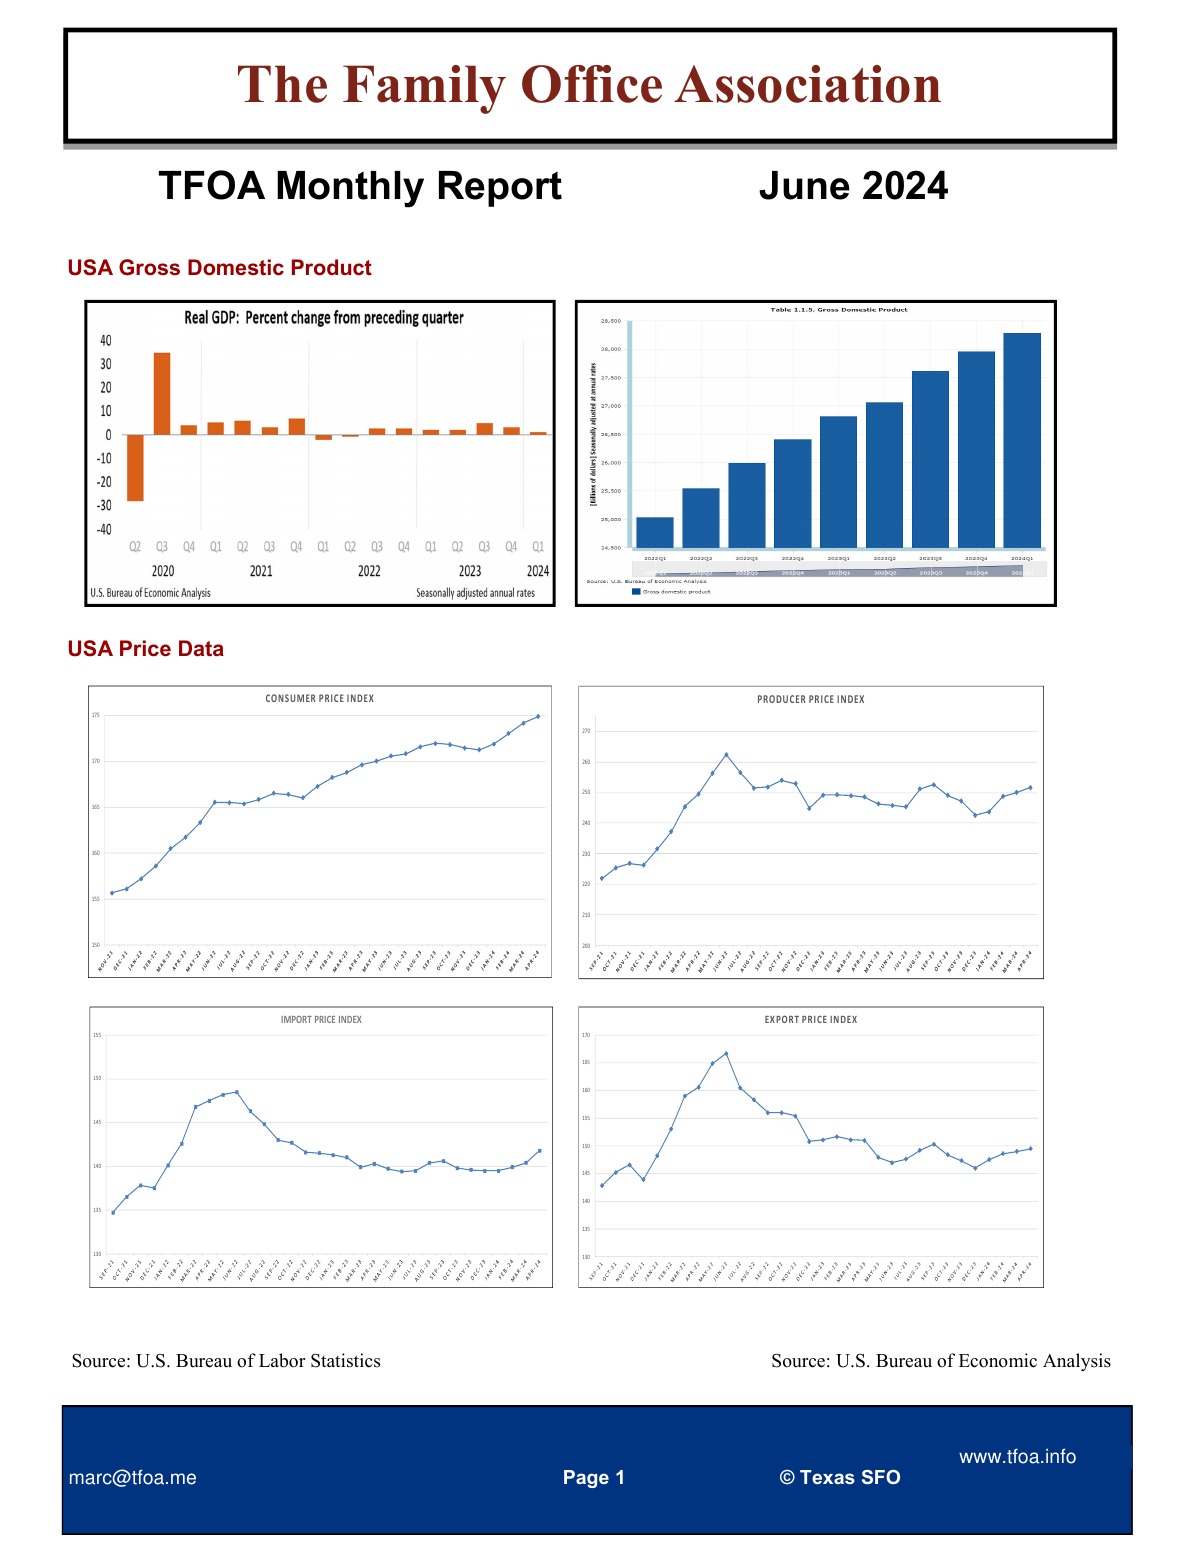
June 2024 — U.S. real GDP grew 3.6% in Q2 2024, with total output near $29.15 trillion. Consumer prices ran at 3.4% year over year (CPI 313.0), the Producer Price Index reached 144.2, and the import and export price indices stood at 141.7 and 149.8. The unemployment rate was 3.9%.
What did U.S. GDP do in the June 2024 TFOA Economic Update?
Real GDP grew 3.6% in Q2 2024, with total U.S. output near $29.15 trillion.
What was inflation in June 2024?
Consumer prices rose 3.4% year over year (CPI 313.0), and the Producer Price Index was 144.2.
What does the June 2024 TFOA Economic Update cover?
U.S. GDP, CPI, PPI, import and export price indices (141.7 and 149.8), the unemployment rate (3.9%), and selected state-level data for California, Florida, New York and Texas.
May 2024
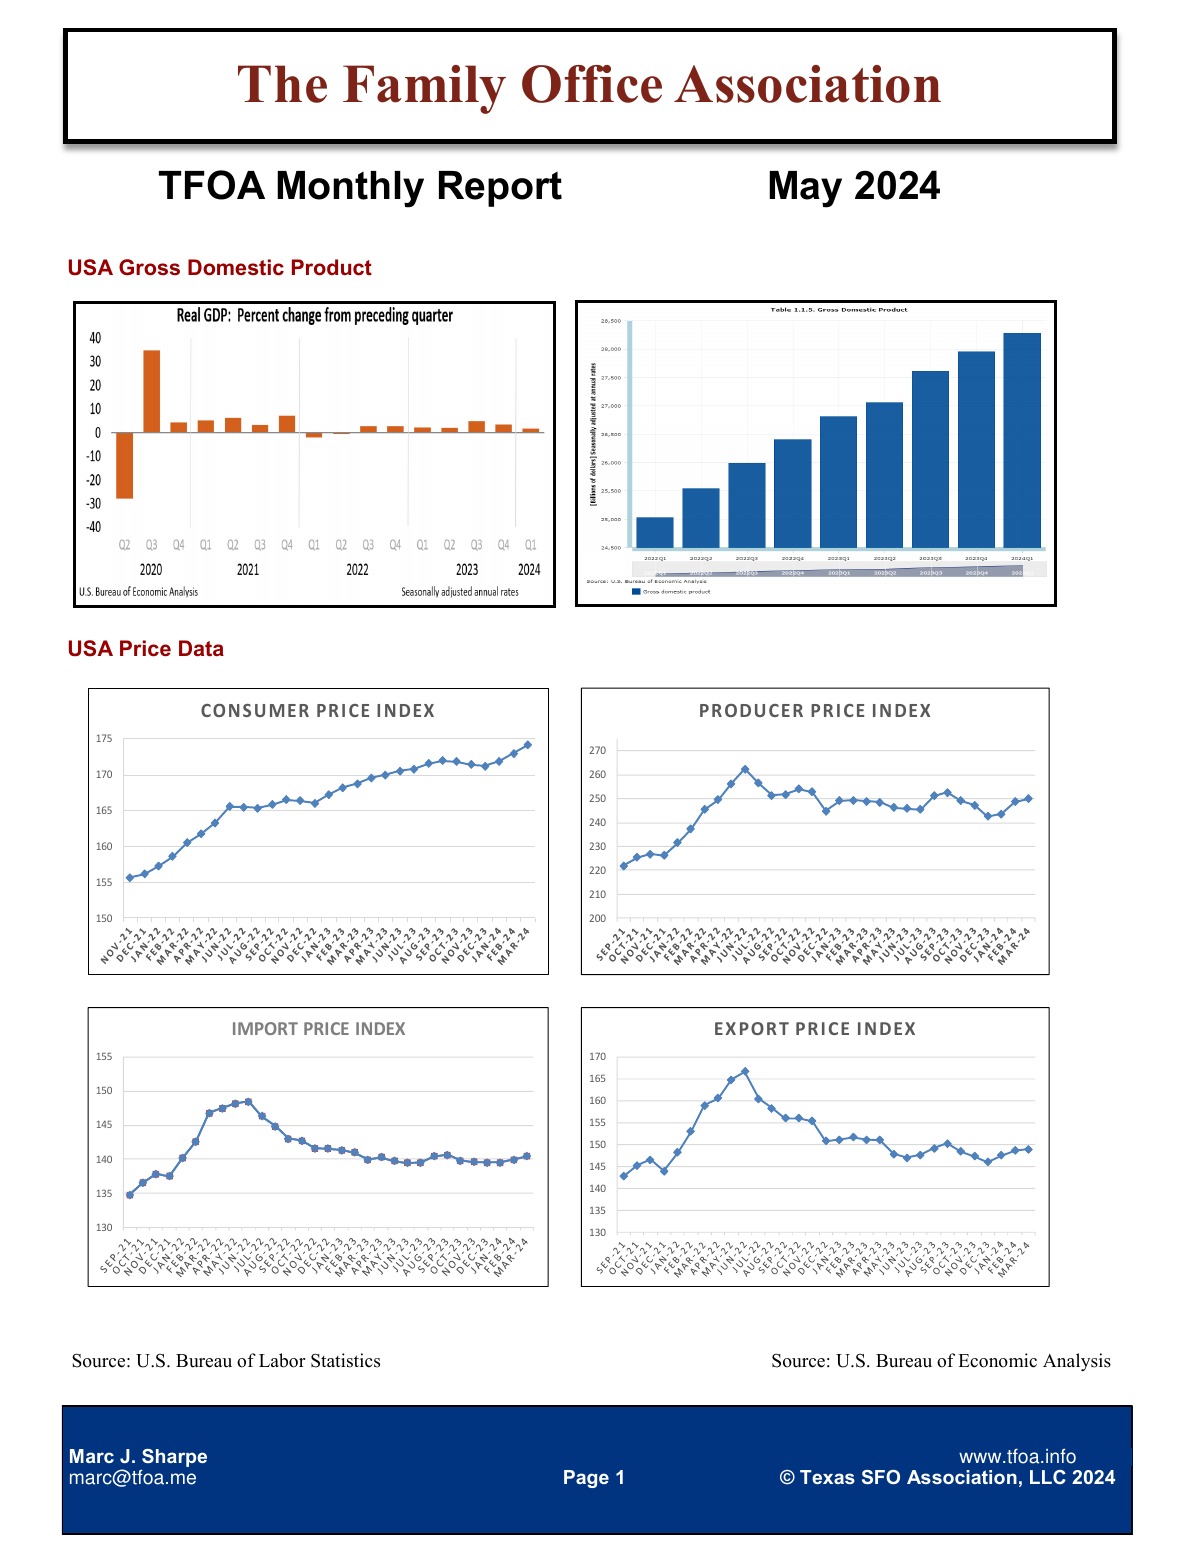
May 2024 — U.S. real GDP grew 3.6% in Q2 2024, with total output near $29.15 trillion. Consumer prices ran at 3.5% year over year (CPI 312.3), the Producer Price Index reached 143.5, and the import and export price indices stood at 140.5 and 148.8. The unemployment rate was 3.9%.
What did U.S. GDP do in the May 2024 TFOA Economic Update?
Real GDP grew 3.6% in Q2 2024, with total U.S. output near $29.15 trillion.
What was inflation in May 2024?
Consumer prices rose 3.5% year over year (CPI 312.3), and the Producer Price Index was 143.5.
What does the May 2024 TFOA Economic Update cover?
U.S. GDP, CPI, PPI, import and export price indices (140.5 and 148.8), the unemployment rate (3.9%), and selected state-level data for California, Florida, New York and Texas.
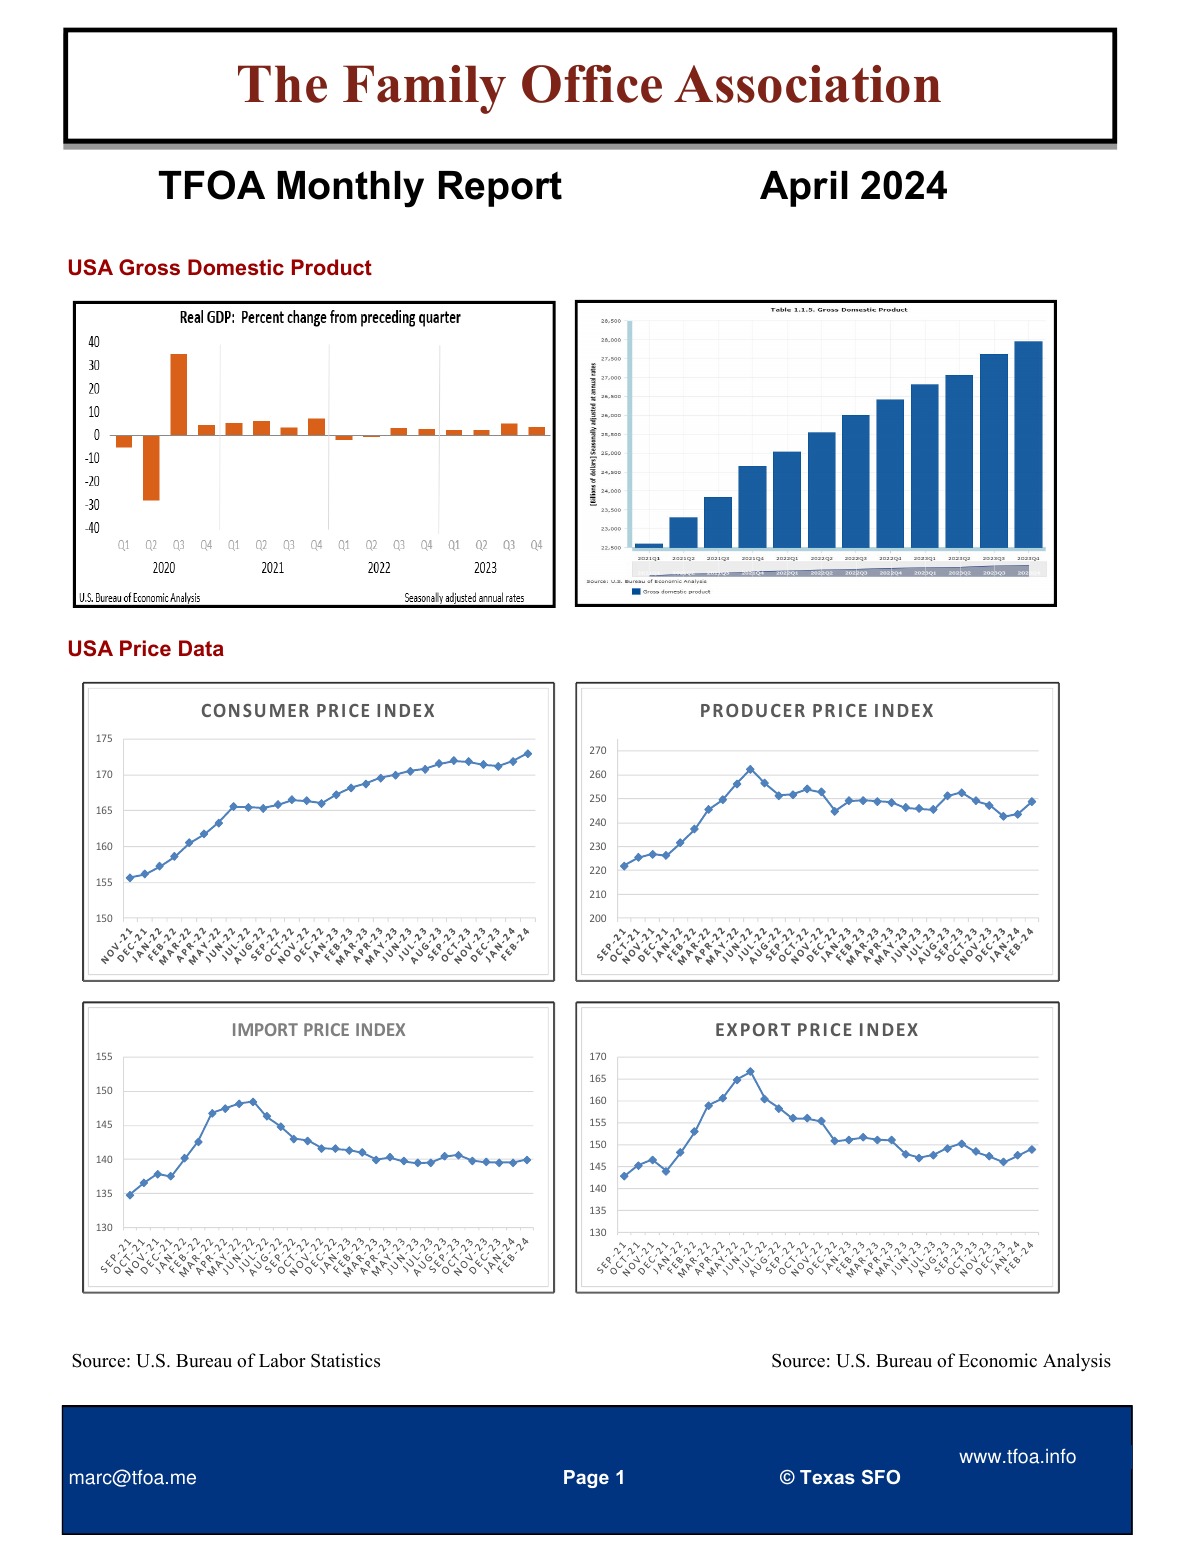
April 2024
April 2024 — U.S. real GDP grew 0.8% in Q1 2024, with total output near $28.71 trillion. Consumer prices ran at 3.2% year over year (CPI 311.0), the Producer Price Index reached 143.4, and the import and export price indices stood at 139.7 and 148.6. The unemployment rate was 3.9%.
What did U.S. GDP do in the April 2024 TFOA Economic Update?
Real GDP grew 0.8% in Q1 2024, with total U.S. output near $28.71 trillion.
What was inflation in April 2024?
Consumer prices rose 3.2% year over year (CPI 311.0), and the Producer Price Index was 143.4.
What does the April 2024 TFOA Economic Update cover?
U.S. GDP, CPI, PPI, import and export price indices (139.7 and 148.6), the unemployment rate (3.9%), and selected state-level data for California, Florida, New York and Texas.
