TFOA monthly economic updates: US GDP, inflation and trade price data for single family offices.

TFOA Monthly Economic Update — August 2025
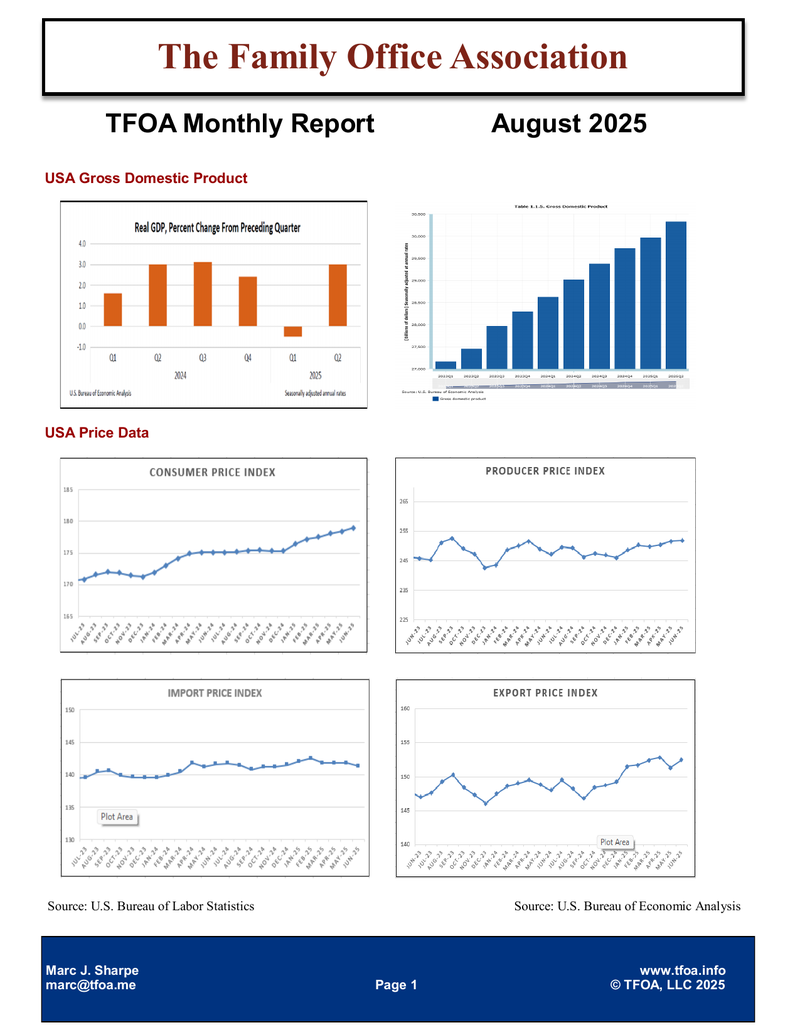
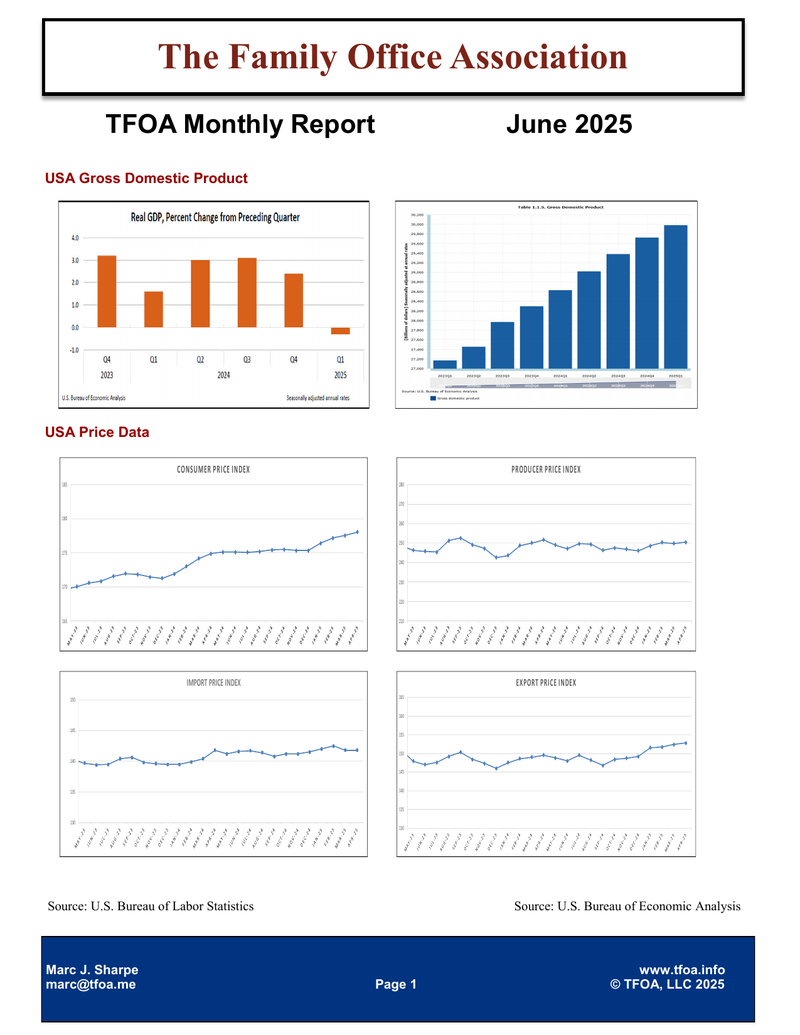
TFOA Monthly Economic Update — August 2025: report cover showing US GDP, CPI, PPI and import/export price charts

August 2025 Economic Highlights

Key figures from this month’s report, sourced from the U.S. Bureau of Economic Analysis and the U.S. Bureau of Labor Statistics:

  • US Gross Domestic Product stood at roughly $30.4 trillion (seasonally adjusted annual rate) in Q2 2025. Real GDP grew at an annualised rate of about 3% in Q2 2025.
  • Consumer Price Index (Chained CPI, C-CPI-U, U.S. city average, all items; December 1999 = 100) was 179 in June 2025.
  • Producer Price Index (total manufacturing industries; December 1984 = 100) was 251.9 in June 2025.
  • Import Price Index (all commodities) was 141.3 in June 2025.
  • Export Price Index (all commodities) was 152.5 in June 2025.

↓ Download the full report (PDF)

The full report contains the complete series, together with employment, interest rate and selected state-level data.

More Economic Updates: Read the July 2025 update, or browse the full archive of monthly Economic Updates.
TFOA Monthly Economic Update — July 2025

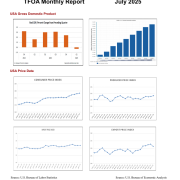
TFOA Monthly Economic Update — July 2025: report cover showing US GDP, CPI, PPI and import/export price charts

July 2025 Economic Highlights

Key figures from this month’s report, sourced from the U.S. Bureau of Economic Analysis and the U.S. Bureau of Labor Statistics:

  • US Gross Domestic Product stood at roughly $30 trillion (seasonally adjusted annual rate) in Q1 2025. The economy contracted at an annualised rate of about 0.3% in Q1 2025.
  • Consumer Price Index (Chained CPI, C-CPI-U, U.S. city average, all items; December 1999 = 100) was 178.4 in May 2025.
  • Producer Price Index (total manufacturing industries; December 1984 = 100) was 251.6 in May 2025.
  • Import Price Index (all commodities) was 141.8 in May 2025.
  • Export Price Index (all commodities) was 151.3 in May 2025.

↓ Download the full report (PDF)

The full report contains the complete series, together with employment, interest rate and selected state-level data.

More Economic Updates: Read the June 2025 update, or browse the full archive of monthly Economic Updates.
TFOA Monthly Economic Update — June 2025

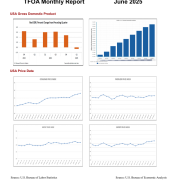
TFOA Monthly Economic Update — June 2025: report cover showing US GDP, CPI, PPI and import/export price charts

June 2025 Economic Highlights

Key figures from this month’s report, sourced from the U.S. Bureau of Economic Analysis and the U.S. Bureau of Labor Statistics:

  • US Gross Domestic Product stood at roughly $30 trillion (seasonally adjusted annual rate) in Q1 2025. The economy contracted at an annualised rate of about 0.3% in Q1 2025.
  • Consumer Price Index (Chained CPI, C-CPI-U, U.S. city average, all items; December 1999 = 100) was 178.1 in April 2025.
  • Producer Price Index (total manufacturing industries; December 1984 = 100) was 250.5 in April 2025.
  • Import Price Index (all commodities) was 141.8 in April 2025.
  • Export Price Index (all commodities) was 152.8 in April 2025.

↓ Download the full report (PDF)

The full report contains the complete series, together with employment, interest rate and selected state-level data.

More Economic Updates: Read the May 2025 update, or browse the full archive of monthly Economic Updates.
TFOA Monthly Economic Update — May 2025

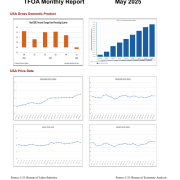
TFOA Monthly Economic Update — May 2025: report cover showing US GDP, CPI, PPI and import/export price charts

May 2025 Economic Highlights

Key figures from this month’s report, sourced from the U.S. Bureau of Economic Analysis and the U.S. Bureau of Labor Statistics:

  • US Gross Domestic Product stood at roughly $30 trillion (seasonally adjusted annual rate) in Q1 2025. The economy contracted at an annualised rate of about 0.3% in Q1 2025.
  • Consumer Price Index (Chained CPI, C-CPI-U, U.S. city average, all items; December 1999 = 100) was 177.5 in March 2025.
  • Producer Price Index (total manufacturing industries; December 1984 = 100) was 249.8 in March 2025.
  • Import Price Index (all commodities) was 141.8 in March 2025.
  • Export Price Index (all commodities) was 152.4 in March 2025.

↓ Download the full report (PDF)

The full report contains the complete series, together with employment, interest rate and selected state-level data.

More Economic Updates: Read the April 2025 update, or browse the full archive of monthly Economic Updates.
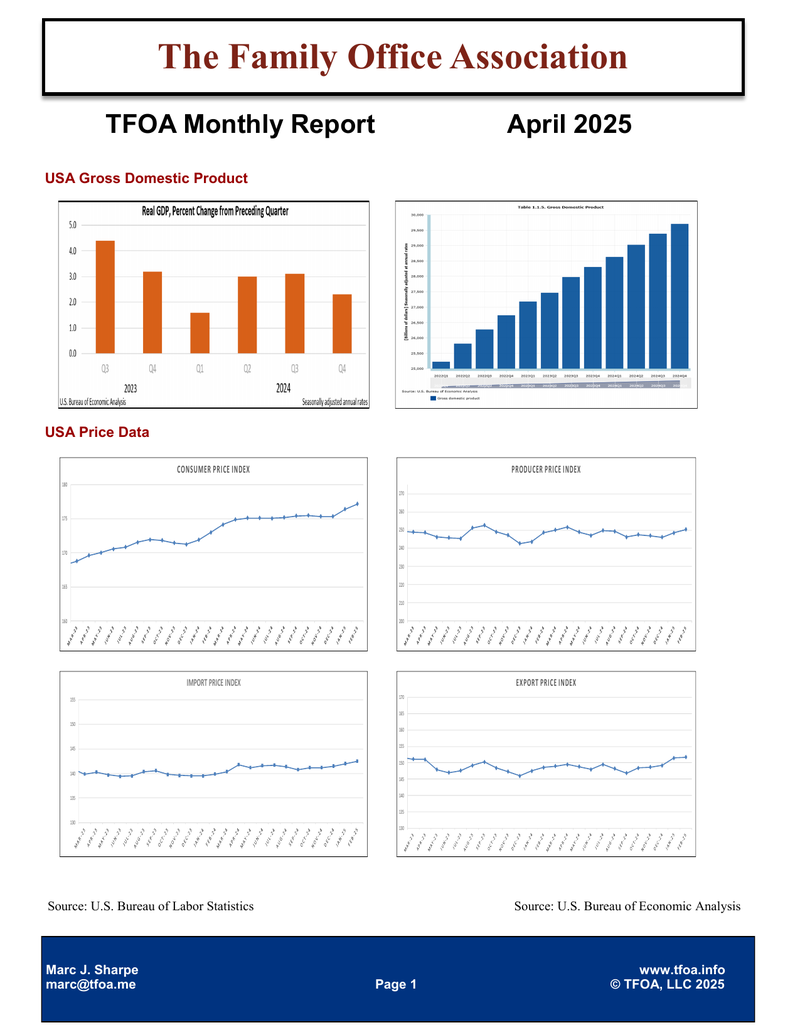
TFOA Monthly Economic Update — April 2025

TFOA Monthly Economic Update — April 2025: report cover showing US GDP, CPI, PPI and import/export price charts

April 2025 Economic Highlights

Key figures from this month’s report, sourced from the U.S. Bureau of Economic Analysis and the U.S. Bureau of Labor Statistics:

  • US Gross Domestic Product stood at roughly $29.7 trillion (seasonally adjusted annual rate) in Q4 2024. Real GDP grew at an annualised rate of about 2.3% in Q4 2024.
  • Consumer Price Index (Chained CPI, C-CPI-U, U.S. city average, all items; December 1999 = 100) was 177.2 in February 2025.
  • Producer Price Index (total manufacturing industries; December 1984 = 100) was 250.3 in February 2025.
  • Import Price Index (all commodities) was 142.5 in February 2025.
  • Export Price Index (all commodities) was 151.7 in February 2025.

↓ Download the full report (PDF)

The full report contains the complete series, together with employment, interest rate and selected state-level data.

More Economic Updates: Read the March 2025 update, or browse the full archive of monthly Economic Updates.

TFOA Monthly Economic Update — March 2025

TFOA Monthly Economic Update — March 2025: report cover showing US GDP, CPI, PPI and import/export price charts

March 2025 Economic Highlights

Key figures from this month’s report, sourced from the U.S. Bureau of Economic Analysis and the U.S. Bureau of Labor Statistics:

  • US Gross Domestic Product stood at roughly $29.7 trillion (seasonally adjusted annual rate) in Q4 2024. Real GDP grew at an annualised rate of about 2.3% in Q4 2024.
  • Consumer Price Index (Chained CPI, C-CPI-U, U.S. city average, all items; December 1999 = 100) was 176.4 in January 2025.
  • Producer Price Index (total manufacturing industries; December 1984 = 100) was 248.6 in January 2025.
  • Import Price Index (all commodities) was 142 in January 2025.
  • Export Price Index (all commodities) was 151.5 in January 2025.

↓ Download the full report (PDF)

The full report contains the complete series, together with employment, interest rate and selected state-level data.

More Economic Updates: Read the February 2025 update, or browse the full archive of monthly Economic Updates.
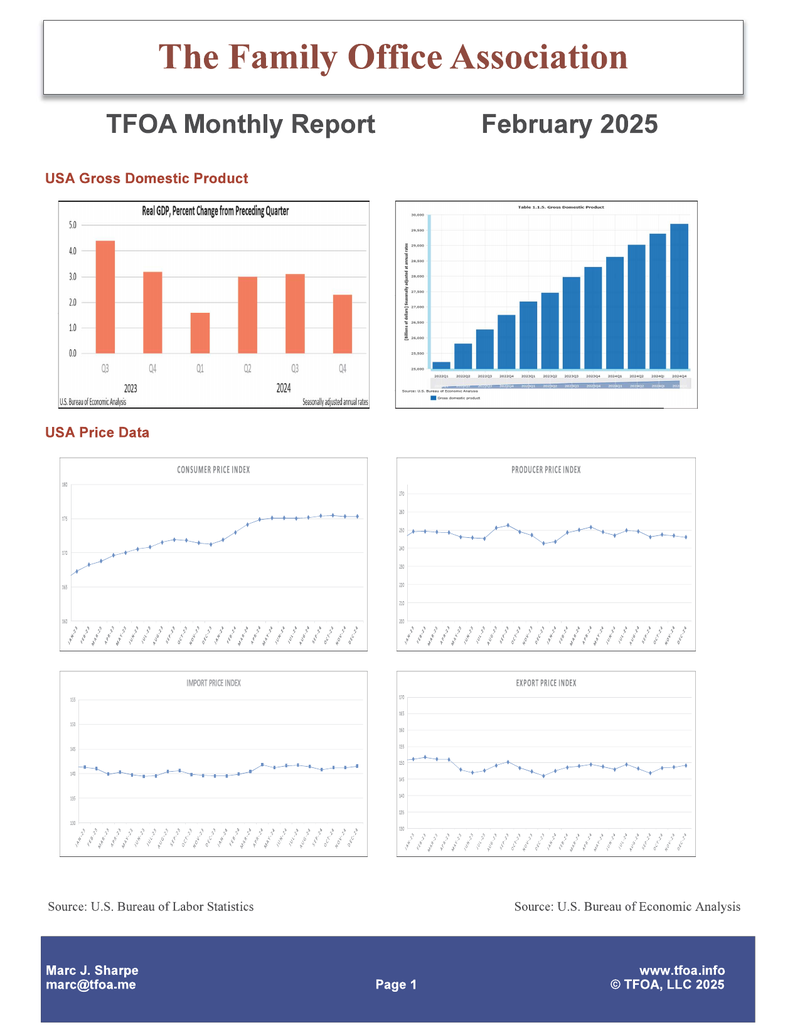
TFOA Monthly Economic Update — February 2025

TFOA Monthly Economic Update — February 2025: report cover showing US GDP, CPI, PPI and import/export price charts

February 2025 Economic Highlights

Key figures from this month’s report, sourced from the U.S. Bureau of Economic Analysis and the U.S. Bureau of Labor Statistics:

  • US Gross Domestic Product stood at roughly $29.7 trillion (seasonally adjusted annual rate) in Q4 2024. Real GDP grew at an annualised rate of about 2.3% in Q4 2024.
  • Consumer Price Index (Chained CPI, C-CPI-U, U.S. city average, all items; December 1999 = 100) was 175.3 in December 2024.
  • Producer Price Index (total manufacturing industries; December 1984 = 100) was 246 in December 2024.
  • Import Price Index (all commodities) was 141.5 in December 2024.
  • Export Price Index (all commodities) was 149.2 in December 2024.

↓ Download the full report (PDF)

The full report contains the complete series, together with employment, interest rate and selected state-level data.

More Economic Updates: Read the January 2025 update, or browse the full archive of monthly Economic Updates.
TFOA Monthly Economic Update — January 2025

TFOA Monthly Economic Update — January 2025: report cover showing US GDP, CPI, PPI and import/export price charts

January 2025 Economic Highlights

Key figures from this month’s report, sourced from the U.S. Bureau of Economic Analysis and the U.S. Bureau of Labor Statistics:

  • US Gross Domestic Product stood at roughly $29.4 trillion (seasonally adjusted annual rate) in Q3 2024. Real GDP grew at an annualised rate of about 3.1% in Q3 2024.
  • Consumer Price Index (Chained CPI, C-CPI-U, U.S. city average, all items; December 1999 = 100) was 175.3 in November 2024.
  • Producer Price Index (total manufacturing industries; December 1984 = 100) was 246.9 in November 2024.
  • Import Price Index (all commodities) was 141.2 in November 2024.
  • Export Price Index (all commodities) was 148.7 in November 2024.

↓ Download the full report (PDF)

The full report contains the complete series, together with employment, interest rate and selected state-level data.

More Economic Updates: Read the December 2024 update, or browse the full archive of monthly Economic Updates.
TFOA Monthly Economic Update — December 2024

TFOA Monthly Economic Update — December 2024: report cover showing US GDP, CPI, PPI and import/export price charts

December 2024 Economic Highlights

Key figures from this month’s report, sourced from the U.S. Bureau of Economic Analysis and the U.S. Bureau of Labor Statistics:

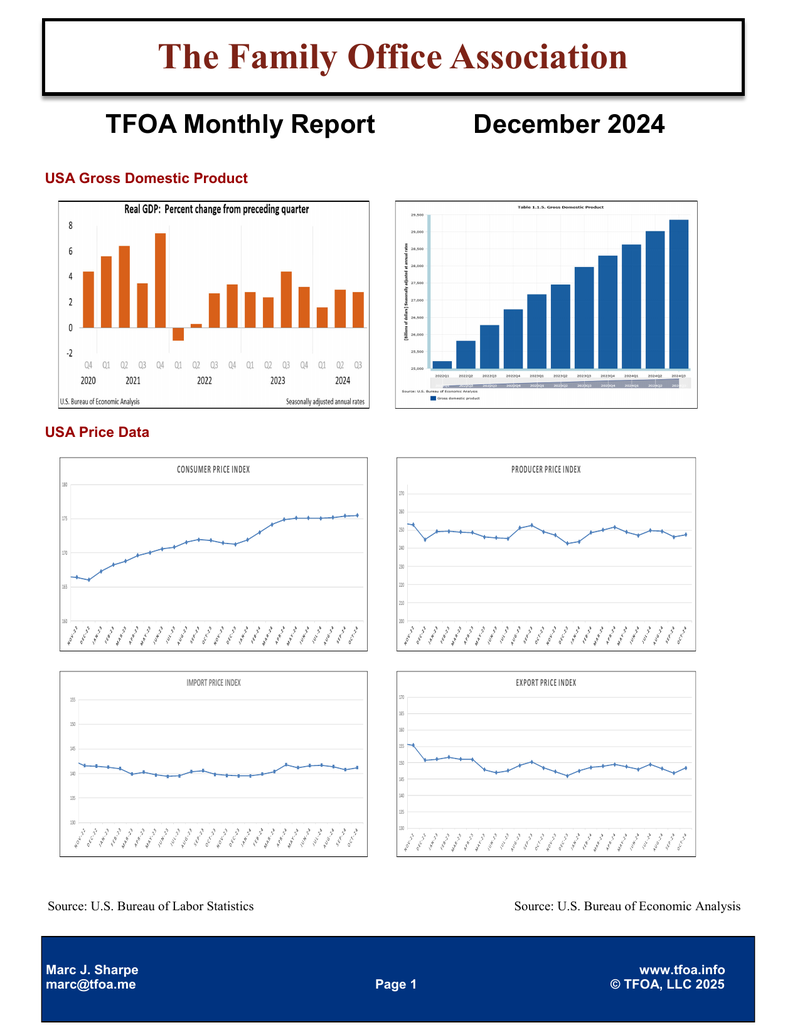
  • US Gross Domestic Product stood at roughly $29.4 trillion (seasonally adjusted annual rate) in Q3 2024. Real GDP grew at an annualised rate of about 2.8% in Q3 2024.
  • Consumer Price Index (Chained CPI, C-CPI-U, U.S. city average, all items; December 1999 = 100) was 175.5 in October 2024.
  • Producer Price Index (total manufacturing industries; December 1984 = 100) was 247.5 in October 2024.
  • Import Price Index (all commodities) was 141.2 in October 2024.
  • Export Price Index (all commodities) was 148.4 in October 2024.

↓ Download the full report (PDF)

The full report contains the complete series, together with employment, interest rate and selected state-level data.

More Economic Updates: Read the November 2024 update, or browse the full archive of monthly Economic Updates.

TFOA Monthly Economic Update — November 2024

TFOA Monthly Economic Update — November 2024: report cover showing US GDP, CPI, PPI and import/export price charts

November 2024 Economic Highlights

Key figures from this month’s report, sourced from the U.S. Bureau of Economic Analysis and the U.S. Bureau of Labor Statistics:

  • US Gross Domestic Product stood at roughly $29.4 trillion (seasonally adjusted annual rate) in Q3 2024. Real GDP grew at an annualised rate of about 2.8% in Q3 2024.
  • Consumer Price Index (Chained CPI, C-CPI-U, U.S. city average, all items; December 1999 = 100) was 175.4 in September 2024.
  • Producer Price Index (total manufacturing industries; December 1984 = 100) was 246.3 in September 2024.
  • Import Price Index (all commodities) was 140.8 in September 2024.
  • Export Price Index (all commodities) was 146.8 in September 2024.

↓ Download the full report (PDF)

The full report contains the complete series, together with employment, interest rate and selected state-level data.

More Economic Updates: Read the October 2024 update, or browse the full archive of monthly Economic Updates.