
TFOA Monthly Economic Update — July 2026
July 2026 Economic Highlights
Key figures from this month’s report, sourced from the U.S. Bureau of Economic Analysis and the U.S. Bureau of Labor Statistics:
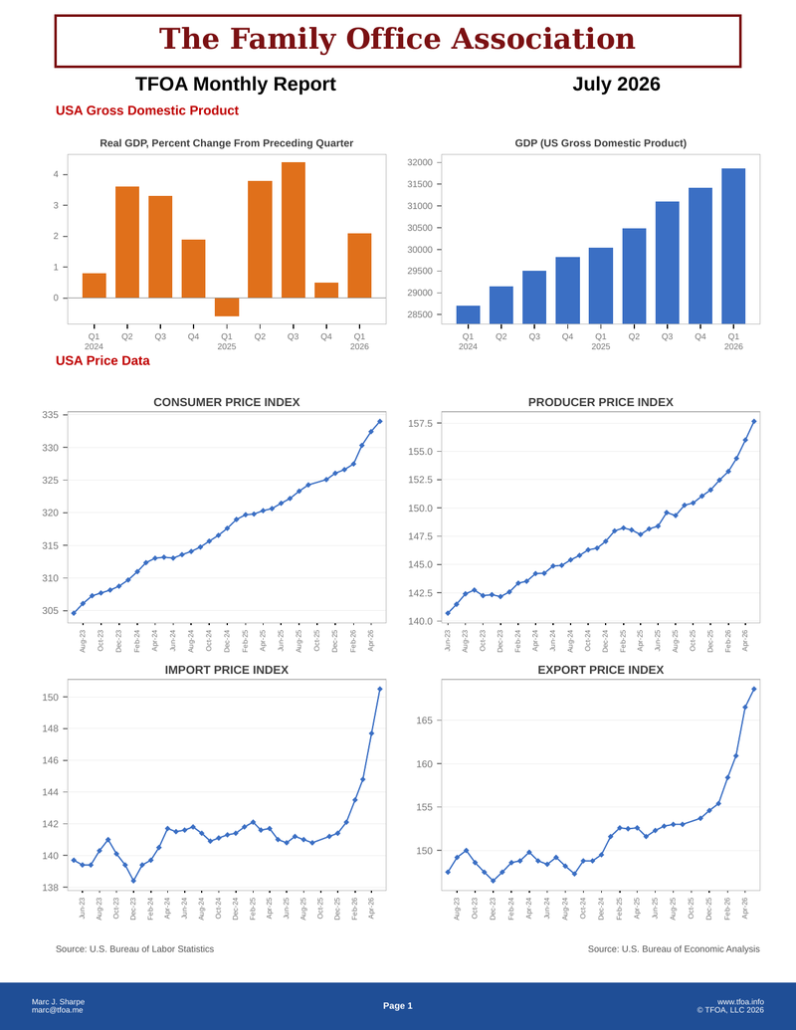
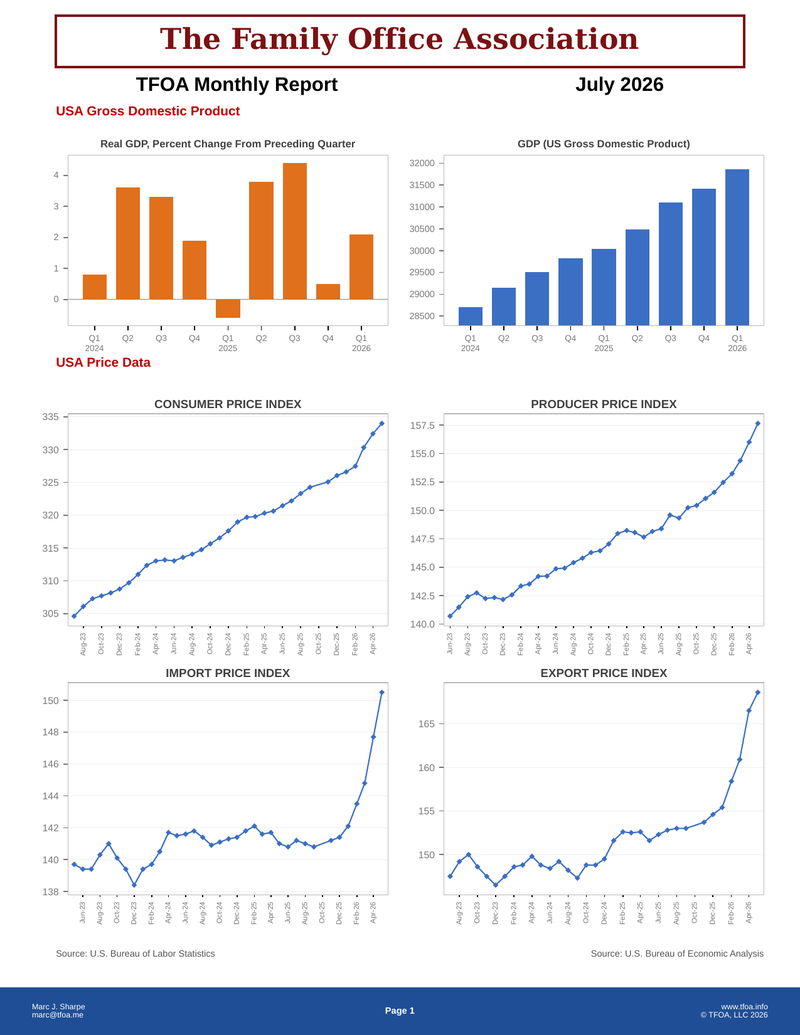
- US Gross Domestic Product stood at roughly $31.9 trillion (seasonally adjusted annual rate) in Q1 2026. Real GDP grew at an annualised rate of about 2.1%.
- Consumer Price Index (CPI-U, all urban consumers; 1982–84 = 100) was approximately 334.
- Producer Price Index (final demand) was approximately 157.7.
- Import Price Index (all commodities) was approximately 150.5.
- Export Price Index (all commodities) was approximately 168.
Note on price index series: Through June 2026 this report tracked the Chained CPI (C-CPI-U; December 1999 = 100) and the PPI for Total Manufacturing Industries (December 1984 = 100). From July 2026 the consumer and producer price charts use the headline CPI-U (1982–84 = 100) and the PPI for Final Demand. Index levels are therefore not comparable across the June/July 2026 boundary; period-over-period percentage changes remain the valid comparison.
↓ Download the full report (PDF)
The full report contains the complete series, together with employment, interest rate and selected state-level data.
More Economic Updates: Read the June 2026 update, or browse the full archive of monthly Economic Updates.


Leave a Reply
Want to join the discussion?Feel free to contribute!